Information Security
Executive TechnicalThree products. Three overlapping attack surfaces. Which combination is worth buying, which vector caused the breach, and whether a product you didn’t deploy would have prevented it.
The Information Security plug-in, vocabulary, structure, and the questions your leaders ask, already mapped. Nothing here starts from a blank page.
The QuestionWhich security investment combination is actually worth the budget?
The MethodA causal model of overlapping attack surfaces, run forward for purchase decisions and backward for breach attribution.
The AnswerA ranked, quantified purchase recommendation, and a defensible answer to whether a different choice would have prevented the breach.
01 The Decision
THE CISO HAS THREE VENDOR PROPOSALS on the table. Product A covers endpoint detection. Product B covers email and identity. Product C covers network perimeter. Each vendor supplies an ROI figure based on industry breach cost data. The risk matrix scores each threat vector independently. The board approves two of the three.
The problem is structural. The three products protect overlapping attack surfaces. A credential-theft attack crosses both the identity layer (Product B) and the endpoint layer (Product A). A perimeter intrusion that pivots to lateral movement is covered by both Product C and Product A. When surfaces overlap, deploying both products does not double the protection, the marginal return of the second product is lower than the vendor’s standalone figure implies. The risk matrix has no mechanism to represent this.
The second problem is confounding. Organisations invest most heavily in the threats they fear most. That means the observed correlation between product deployment and breach reduction mixes the product’s causal effect with the elevated baseline threat that drove the purchasing decision. Vendor ROI figures built from observational data inherit this bias.
02 The solution
The causal graph encodes three threat vectors, three products, and the overlap structure explicitly. Each product node severs its portion of the threat pathway when set via do(), isolating the marginal contribution of that product given what else is deployed.
ThreatVec_Endpoint → ExposureA → BreachProbability
ThreatVec_Identity → ExposureB → BreachProbability
ThreatVec_Perimeter → ExposureC → BreachProbability
# Products (intervention nodes)
Product_A covers ThreatVec_Endpoint (1.0), ThreatVec_Identity (0.25 partial)
Product_B covers ThreatVec_Identity (1.0), ThreatVec_Endpoint (0.25 partial)
Product_C covers ThreatVec_Perimeter (1.0), ThreatVec_Identity (0.30 partial)
# Outcome
BreachProbability = f(ExposureA, ExposureB, ExposureC, U_Breach)
ExpectedLoss = BreachProbability × BreachSeverity
The overlap is encoded structurally. ThreatVec_Identity feeds ExposureB (primary) but also partially into ExposureA (credential theft lands on endpoints). When Product A is deployed, it reduces ExposureA, but not all of the identity-vector contribution, because that pathway also runs through ExposureB. The marginal return of A+B is therefore less than the sum of their standalone figures.
The solution was to model the relationships between the variables that determine breach risk, and to be explicit about which variables cause which. We recognised, for example, that the three attack surfaces are not independent, a credential theft attack crosses both the identity and endpoint layers, which means deploying a product that covers one surface also partially reduces exposure on the other. That overlap means the marginal value of a second product is always lower than its standalone figure implies, and the right combination depends on which surfaces are already covered, not just on which products have the highest vendor ROI. When you observe a variable in this model, you are effectively filtering the data to cases where that variable takes a particular value, and that filter ripples through the model, shifting related variables up and down accordingly. When you intervene on a variable, forcing it to a value regardless of what caused it, you break that ripple effect and get a cleaner answer: not what organisations that look like this tend to experience, but what would happen if this specific product were deployed When you abduct, you extract a particular case from the averages, locking in its idiosyncratic circumstances before asking what would have happened if one or more things had been different.
Budget: $2.4M across three products. Product A: $1.0M. Product B: $0.8M. Product C: $0.6M. The model ranks combinations by marginal breach reduction per dollar, not standalone vendor ROI.
03 What the solution answers
obs(Breach = True, LateralMovement = True) propagates backward through the graph. Lateral movement is structurally linked to endpoint compromise, not perimeter intrusion.
ThreatVec_Endpoint updates to 67% as primary vector. Perimeter intrusion drops to 9%, it rarely produces lateral movement without prior endpoint foothold. Directs IR effort before forensics are complete.
| Deployment | Breach reduction | Cost | Δ / $M |
|---|---|---|---|
| do(A only) | 30% | $1.0M | 30pp/$M |
| do(B only) | 17% | $0.8M | 21pp/$M |
| do(C only) | 13% | $0.6M | 22pp/$M |
| do(A + C) Chosen | 44% | $1.6M | 28pp/$M |
| do(A + B) | 48% | $1.8M | 27pp/$M |
| do(A + B + C) | 61% | $2.4M | 25pp/$M |
A+C wins on efficiency (28pp/$M vs 27pp/$M) because their primary surfaces are fully complementary, endpoint and perimeter with no overlap. A+B costs $200K more and delivers only 4pp of additional reduction, because Product A already covers 30% of the identity surface that B targets. C has no identity overlap at all, making it the ideal second product given A is already deployed.
Product A was deployed. A credential-theft breach occurred via the identity vector. Abduct U_Breach and U_Identity to this specific incident, then apply do(Product_B = deployed).
BreachProbability drops to 31%: material reduction, not prevention. ThreatVec_Endpoint still partially feeds ExposureA outside Product B’s coverage. The honest counterfactual for the board: Product B would have materially reduced the probability of this specific breach, but the right second product for this organisation’s threat profile was C, not B.
04 Inside the Model
A language model can speak fluently about any domain. It cannot know one. The .bayes file is the knowledge the LLM is missing: a causal map of the domain, auditable, versioned, and wrong in specific correctable ways.
Optionally open CyberSecProductSelection.bayes in Bayes Server. The model is the thing; the software that runs it is a commodity.
Rung 1, Diagnostic: which vector caused the breach?
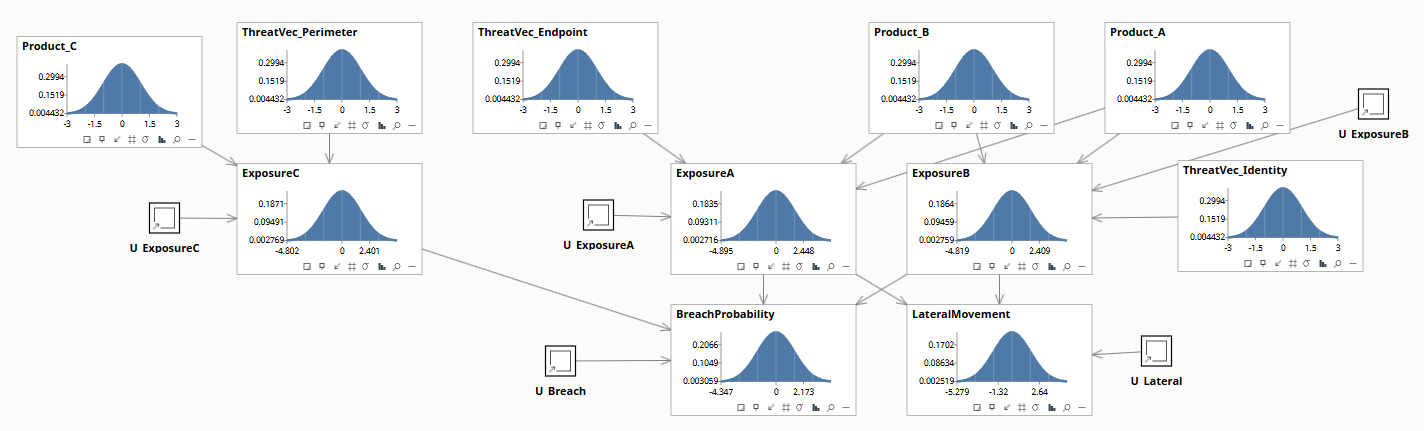
Three threat vectors at prior likelihoods. No products deployed. BreachProbability at population baseline.
Rung 2, Intervention: which product combination to buy?
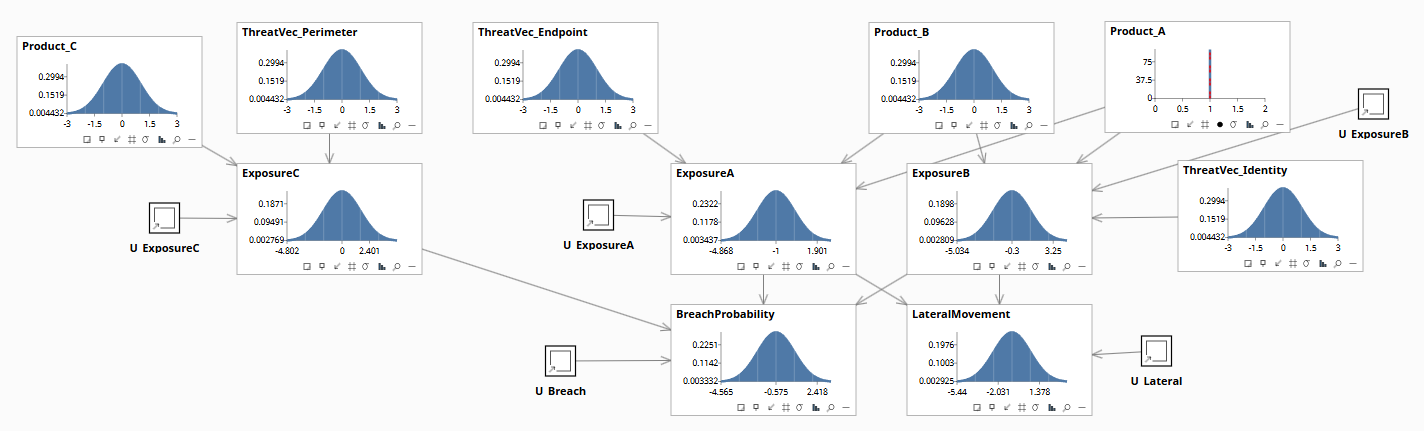
Product A severs ThreatVec_Endpoint from ExposureA and partially reduces identity exposure. Breach reduction: 30% at 30pp/$M.
Rung 3, Counterfactual: would Product B have prevented the breach?
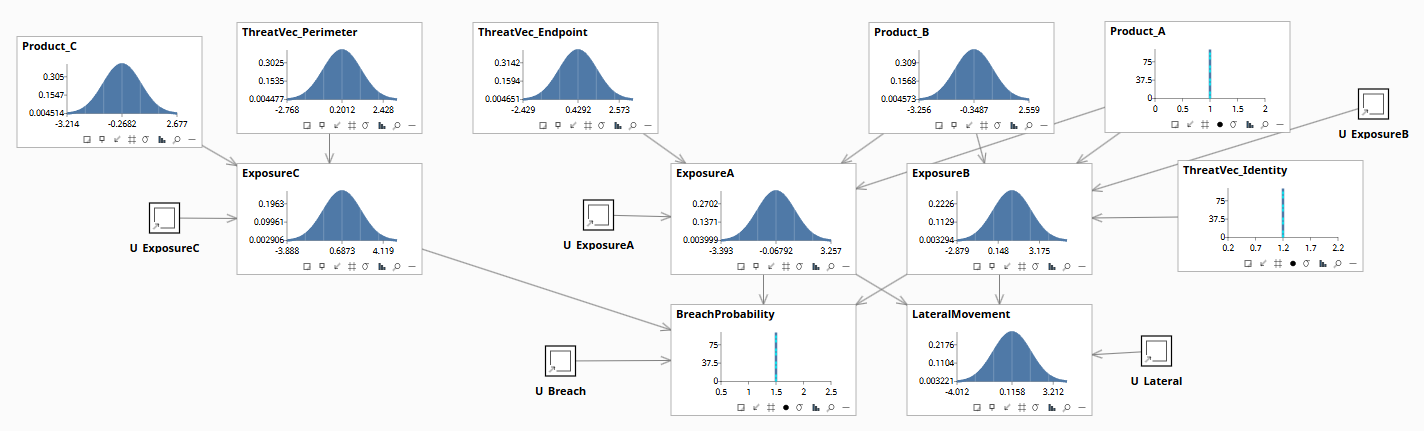
Product A deployed, identity-vector breach observed. U nodes anchored to this specific incident. Ready for counterfactual.
05 Just Ask
The model is a file. Any capable LLM can load its XML and answer product selection, marginal ROI, and post-breach counterfactual questions in plain English.
Same model, three rungs. The audit trail is the .bayes file, not the vendor deck.
- Coverage gap analysis. Which attack vectors remain uncovered if we only fund two of the three products?
- Renewal justification. Did last year's investment measurably reduce breach probability?
- Vendor consolidation. Would replacing two point solutions with one platform change the causal picture?
- Loss forecasting. Given current control gaps, what is the expected loss if a specific threat actor targets us?
- Budget reallocation. Which control, if underfunded, would most increase expected loss?
06 The Engagement
Elicit the overlap structure from your security architects, they already know that a credential-theft attack lands on both identity and endpoint layers. Encode that as directed edges with overlap coefficients. Parameterize from your incident history and threat intelligence.
- Budget allocation. Which combination of products maximises breach reduction at your budget constraint, accounting for overlap, not ignoring it.
- Vendor negotiation. The model quantifies exactly how much marginal value each product adds given what else you have deployed. That is the number to negotiate against.
- Post-breach defence. When the board asks whether a different purchasing decision would have prevented the breach, the counterfactual gives a probability with explicit assumptions, not a yes/no that can’t survive scrutiny.
- Annual refresh. As your threat profile shifts and new products enter the market, the model reruns the comparisons. The structure stays; the parameters update.
This case study uses a synthetic threat model with illustrative overlap coefficients. No individual organisation, vendor, or product is described.
The Deeper Trade
The model does not replace the expert who built it. It frees her from being the bottleneck for every routine version of this question, so she can spend her judgment on the cases that actually need it, and keep making the model better.