Utilities
Executive TechnicalWhich equipment interventions most reduce ignition risk on average, and whether replacing that specific fitting would have prevented that specific fire.
The Utilities plug-in, vocabulary, structure, and the questions your leaders ask, already mapped. Nothing here starts from a blank page.
The QuestionWould replacing that specific fitting have prevented that specific fire?
The MethodA causal model run both on average, for capital planning, and counterfactually, for a single incident.
The AnswerA per-incident counterfactual answer, not just a population-level risk-reduction average.
01 The Decision
UTILITY-CAUSED WILDFIRE FOLLOWS A TEXTBOOK DIRECTED ACYCLIC GRAPH. Equipment condition determines whether a conductor fails during high winds. Wind severity and vegetation proximity determine whether a failed conductor produces ignition. Ignition determines whether a catastrophic fire results. Under California’s inverse condemnation doctrine, liability is the downstream consequence of the entire causal chain, not of negligence, but of causation. A risk score gives the board a number. The causal model gives the board a mechanism: which equipment decision, on which span, would have changed which outcome, by how much.
The model also reveals the central confound in observational PSPS analysis. Utilities de-energise lines during Red Flag Warning conditions, the same conditions that drive high wind severity. Any analysis that treats PSPS status as observed rather than intervened on will systematically underestimate the protective effect of de-energisation, because the observed data conflates the intervention with the weather that triggered it. Only the do() operator severs this back-door path.
| Analysis Component | Standard Approach | Causal Approach |
|---|---|---|
| Where does ignition risk concentrate? (Rung 1) | “Wildfire: High”, one risk score; no conditional structure | Enter what you know; graph encodes which nodes are genuinely connected, so only those update, no spurious propagation |
| What does de-energising lines deliver? (Rung 2) | Observational data conflates de-energisation with the extreme weather that triggered it, understating the true protective effect | do(PSPS = De-energised) severs the back-door path from Red Flag Warning, weather stays at prior, isolating the true causal effect |
| Would this fire have occurred with the fitting replaced? (Rung 3) | Cannot answer, risk scores offer no mechanism for conditioning on specific past events | Abduct U_EC from factual conditions, then do(Equipment Condition = Good), ignition probability drops from 12.1% to 2.9% |
02 The solution
- Would this fire have occurred if the fitting had been replaced?: Rung 3. Abduct to the specific event’s Red Flag Warning, incident history, and equipment age. Apply do(Equipment Condition = Good). Isolate what would have changed for this circuit on that day.
- What does de-energising lines actually deliver in terms of ignition probability reduction?: Rung 2. do(PSPS = De-energised) severs the back-door path from Red Flag Warning, removing the confounder that causes observational data to understate the true protective effect.
- Where does ignition risk concentrate across the circuit portfolio?: Rung 1. Enter observed evidence; read which upstream states become more probable. Identifies circuits to inspect. Rung 2 tells you whether acting there changes the outcome.
Black check mark = observed evidence (a fact entered as a filter). Red check mark = do() intervention (a decision applied, severing the influence of parents).
The solution was to model the relationships between the variables that determine ignition risk, and to be explicit about which variables cause which. We recognised, for example, that PSPS de-energisation decisions are not independent of weather conditions, utilities de-energise most aggressively when Red Flag Warnings are active, which are the same conditions under which ignition risk is highest. That correlation means observational data understates how much de-energisation actually reduces risk, because it is always deployed against the hardest conditions. Equipment age and maintenance history both influence ignition probability, but through different mechanisms: one determines baseline failure rate, the other determines whether a known deficiency was addressed before a high-risk period. When you observe a variable in this model, you are effectively filtering the data to cases where that variable takes a particular value, and that filter ripples through the model, shifting related variables up and down accordingly. When you intervene on a variable, forcing it to a value regardless of what caused it, you break that ripple effect and get a cleaner answer: not what circuits that look like this tend to produce, but what would have happened if this specific condition had been different When you abduct, you extract a particular case from the averages, locking in its idiosyncratic circumstances before asking what would have happened if one or more things had been different.
03 What the solution answers
Rung 2 tells you what replacing equipment does on average. Courts ask a narrower question: given this specific circuit, this specific weather, this specific incident history, what would have happened if that fitting had been in good condition?
Ignition probability drops from 12.1% to 2.9% under the counterfactual. Not to zero, extreme Red Flag conditions remain. That is the honest answer a court requires: a probability with explicit assumptions about what else was true that day.
Lines are de-energised during the same Red Flag events that drive high ignition risk. Setting PSPS = De-energised as an intervention severs that back-door path.
do(PSPS = De-energised): ignition 97.4% No. obs(PSPS = De-energised): ignition 96.7% No. The 0.7-point gap is the confounder fingerprint. Any cost-effectiveness analysis of PSPS built on historical operations data inherits this bias and understates the true causal reduction.
Enter observed evidence; read which upstream states become more probable. Identifies circuits to inspect. Does not assert causation, that is Rung 3.
obs(Liability = High): Equipment Condition Failed 18.5% → 43.7%. Ignition Certain 9.8% → 61.4%. Adding Wind = Extreme: Failed 51.7%. Adding Incident History = Severe: Failed 58.7%. Each observation narrows the diagnostic picture additively.
04 Inside the Model
A language model can speak fluently about any domain. It cannot know one. The .bayes file is the knowledge the LLM is missing: a causal map of the domain, auditable, versioned, and wrong in specific correctable ways.
Optionally open UtilityWildfireCausal.bayes in Bayes Server or any equivalent tool. The model is the thing; the software that runs it is a commodity.
Rung 1, Diagnostic: where does ignition risk concentrate?
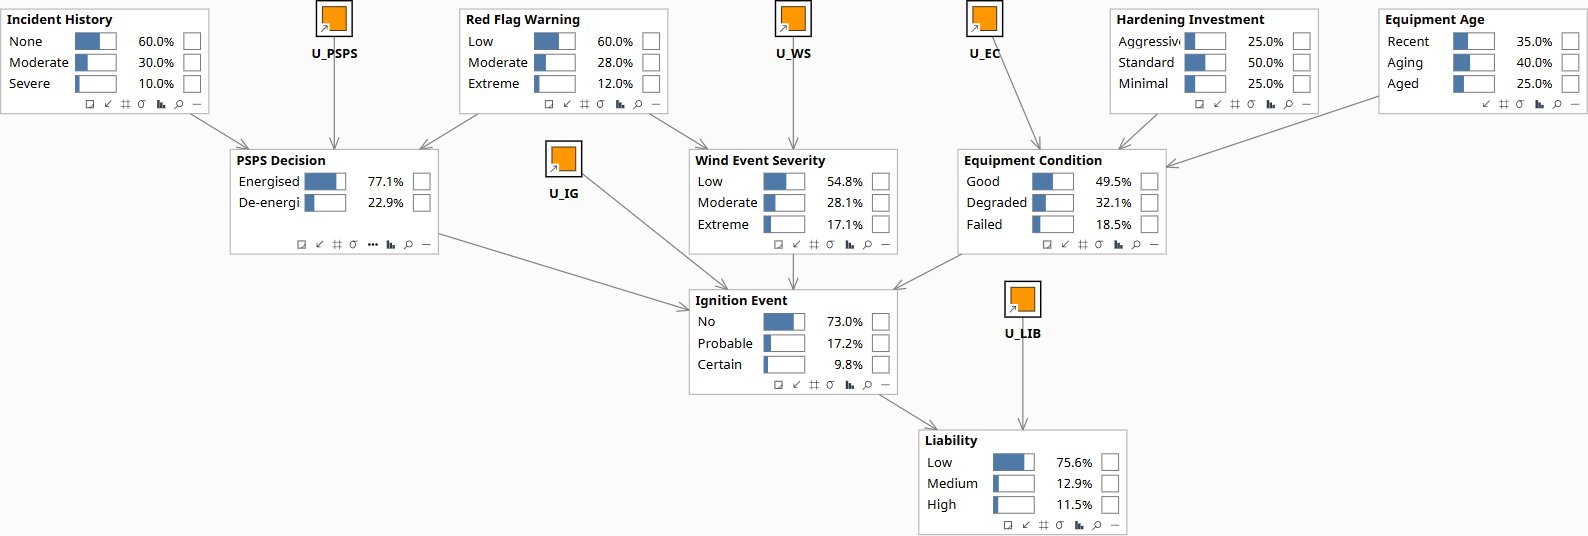
Baseline. EC: 49.5% Good / 32.1% Degraded / 18.5% Failed. Ignition: 73.0% No / 17.2% Probable / 9.8% Certain. Liability: 75.6% Low / 12.9% Med / 11.5% High.
Rung 2, Intervention: do() vs obs() on PSPS
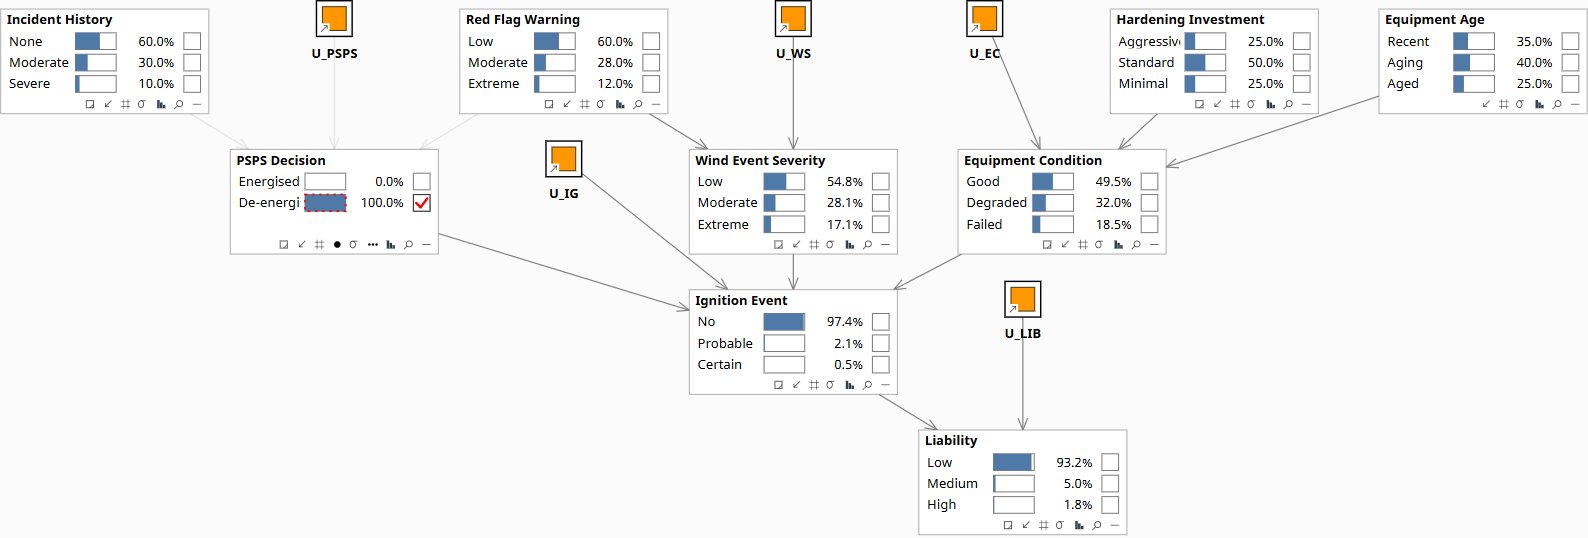
Back-door severed. Red Flag stays at prior. Ignition: 97.4% No. True causal effect isolated.
Rung 3, Counterfactual: would the fitting replacement have prevented the fire?
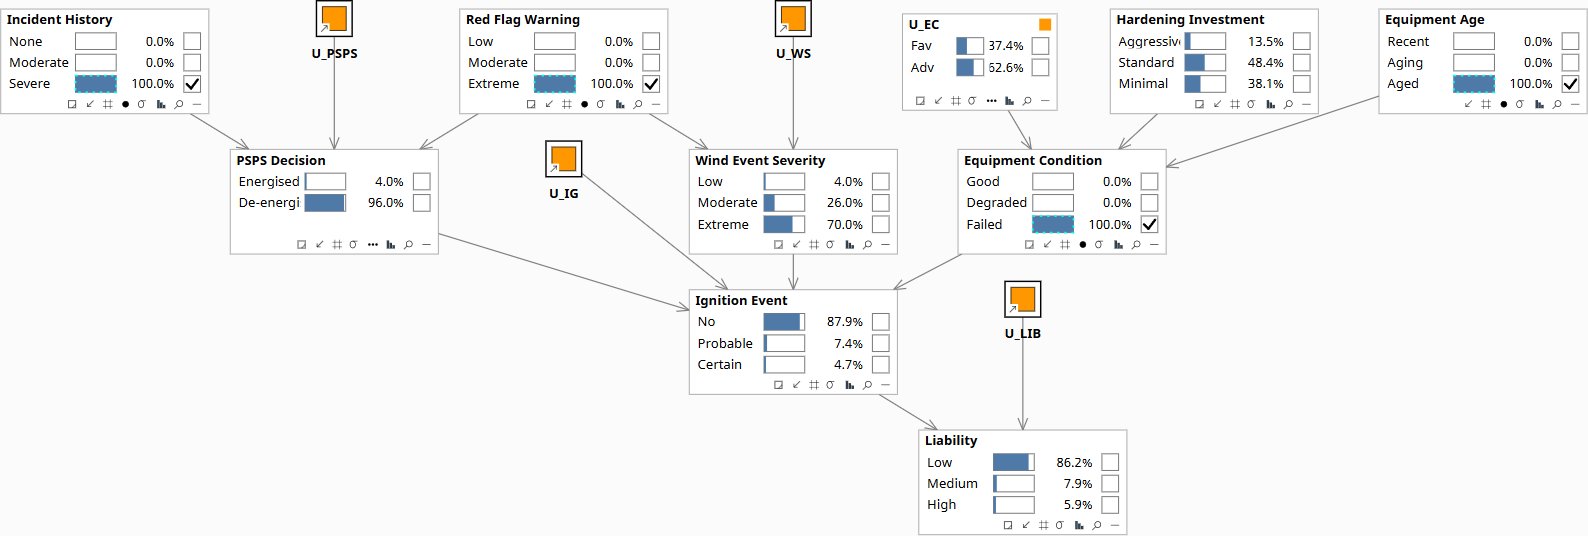
U_EC shifts from 50/50 to 37.4% Fav / 52.6% Adv. This circuit's background anchored. Ready for counterfactual.
05 Just Ask
The model is a file. Any capable LLM can load its XML and answer wildfire liability and PSPS questions in plain English.
Same model, three rungs. The audit trail is the .bayes file, not the risk score.
- Capital prioritization. Which circuit segment has the highest expected ignition-risk reduction per dollar?
- Weather sensitivity. How does the causal risk change under red-flag wind conditions?
- Regulatory defense. What is the expected reduction in ignition probability from this year's hardening program?
- Comparable incidents. Does the same equipment factor explain a different fire in the same season?
- Maintenance scheduling. Which asset's risk trajectory justifies moving up its inspection date?
06 The Engagement
If a fire starts from utility equipment tomorrow, the question will not be whether wildfire was on the risk register. It will be whether the investment decisions were the best use of available resources given what was knowable. The causal model provides that answer, before the fire, not after.
- Pre-litigation defence. A counterfactual probability with explicit assumptions survives cross-examination. A risk score does not.
- PSPS cost-effectiveness. Tightening thresholds requires knowing the true causal reduction per event, not the observational estimate confounded by the weather that triggers PSPS.
- Capital allocation. The diagnostic identifies which circuits, under which conditions, are most consistent with a high-liability outcome.
This case study is a composite drawn from published literature and practice. Specific figures are representative. No individual organisation or engagement is described.
The Deeper Trade
The model does not replace the expert who built it. It frees her from being the bottleneck for every routine version of this question, so she can spend her judgment on the cases that actually need it, and keep making the model better.