Inference
Executive TechnicalA model encodes what the domain knows. Inference is what you do with that knowledge, the act of querying the model to answer a specific question, in a specific direction, from specific evidence.
01 The Gap
Your AI produces outputs. It can’t tell you which direction the reasoning ran.
Every AI system in your organization produces outputs. Very few of them can tell you which direction the reasoning ran. A fraud score says 0.87, was that computed forward from known features, or backward from a flagged outcome? A demand forecast says 14,000 units, is that a prediction from current conditions, or a projection from an assumed intervention? The question matters because a forward prediction and a backward attribution look identical on a dashboard and require entirely different responses from the person reading them.
Without explicit inference direction, the model is being queried but the question is invisible. The answer arrives without an account of what was asked. That is not an interpretability problem. It is a logical one, and it cannot be fixed by adding more data or a better model. It can only be fixed by making inference direction a first-class concept in the architecture.
02 What inference is
A graph with probabilities. Three ways to query it.
A causal model is a graph: nodes are variables, edges are causal relationships, and each node carries a probability distribution, prior beliefs about its possible states, updated by evidence. The graph encodes the domain. Inference is the computational act of updating that graph given new information and reading off the result.
Concretely: you set some variables to observed values (evidence), and you ask what that implies about other variables you cannot directly observe. The model propagates the evidence through its structure according to the causal relationships encoded in it, and returns a posterior distribution: a revised probability over the unknown variable's possible states. That distribution is the answer to your question.
The graph doesn't change when you query it. The posterior does. You can run the same model against a hundred different evidence sets and get a hundred different answers, each one derived from the same underlying causal structure, each one traceable back to the structure that produced it.
A concrete way to see this: suppose A is the true state of something you cannot directly observe, and B is a sensor of A, a reading, a test result, a reported value. We know P(B|A): how reliable the sensor is: how often B is correct when A is in each of its states, and how often it is wrong. Given an observed value of B, inference inverts through that to return P(A|B): the posterior over the true state, given the reading. You don't need the sensor to be perfect. You need to have encoded honestly how imperfect it is. The model does the rest.
This generalises immediately: a claim report is a sensor of the true cause of loss. A SIEM alert is a sensor of an attacker's action. A clinical test result is a sensor of disease state. A fraud score is a sensor of actual fraud. In every case the question is the same, what does this observation imply about the hidden state that produced it?, and the answer comes from propagating the evidence backward through the graph.
The same logic extends to multiple sensors. If B₁, B₂, and B₃ each measure A independently, each with its own known error rate, the model combines their evidence through Bayesian updating, revising the posterior over A each time a new observation arrives. No single sensor needs to be reliable. The aggregate can be highly informative even when each individual reading is weak. This is the mechanism behind diagnostic reasoning in medicine, alert triage in security operations, and multi-signal fraud detection, and it is why a causal model with honest error encodings outperforms a threshold rule on any single measurement.
03 Three directions
Forward predicts. Backward diagnoses. Interventional decides.
Inference runs in three directions. Forward inference propagates from causes to effects, prediction. Backward inference propagates from effects to causes, attribution. Interventional inference applies the do-operator, severs a node's incoming edges, and asks what would change downstream, the what-if query that correlation cannot answer.
The same model can be queried in all three directions. Each corresponds to a rung on Pearl's Ladder of Causation, and each answers a categorically different kind of question.
These are not three models. They are three queries on one model. The structure, the graph and its parameters, is the same in all three cases. What changes is the direction evidence flows, and whether the do-operator is applied.
04 One model, three questions
No separate systems for prediction, diagnosis, and decision support.
The architectural consequence is that an organization does not need separate systems for prediction, decision support, and post-incident attribution. It needs one model, queried correctly. The same .bayes file that answers a fraud underwriter's forward question answers the regulator's backward question after a claim dispute and the CFO's interventional question before a control investment.
| Stakeholder | Question type | Query direction | Example |
|---|---|---|---|
| Underwriter | Prediction | Forward | What is the expected loss on this book? |
| CISO | Decision | Interventional | What does deploying this control buy us in expected loss reduction? |
| Claims adjuster | Attribution | Backward | What caused this loss? Which factors were decisive? |
| Regulator | Accountability | Counterfactual | Would this outcome have occurred if the organization had acted differently? |
| Board | Investment | Interventional | What is the expected value of this risk program relative to its cost? |
Each of these queries runs on the same graph. The parameters are set once, from expert elicitation and data. The inference engine handles the direction. The LLM handles the language. None of these stakeholders needs to know which direction their question required, that is the model's job, not theirs.
The screenshots below show Coastal_Property.bayes open in Bayes Server, the same model, queried three ways.
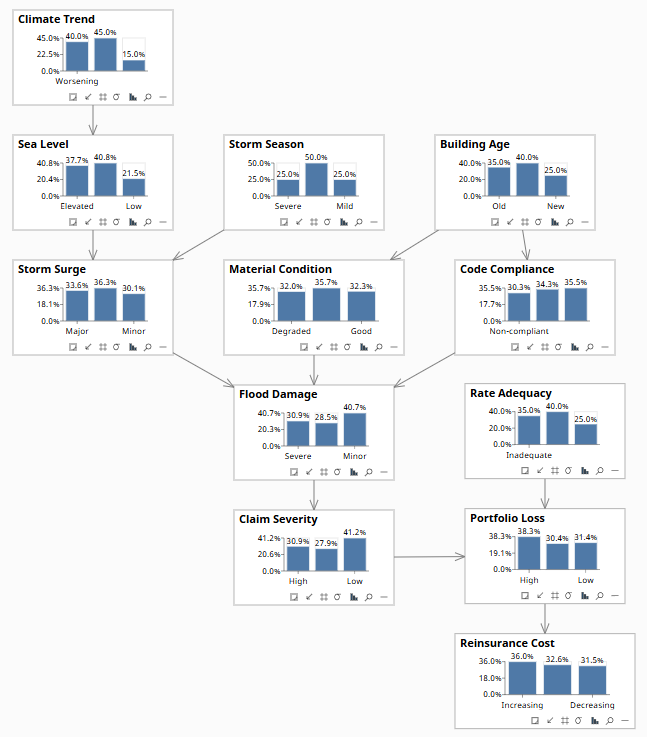
Baseline beliefs before any evidence is set. The model reflects the portfolio's prior distribution across climate, storm season, building age, and rate adequacy.
05 Query in plain English
A portfolio manager asks. The model routes, queries, and answers.
A portfolio manager asks a question. The LLM parses the intent, identifies the inference direction, queries the model, and returns a structured answer, with provenance.
Coastal_Property.bayes, a 12-node structural causal model running from Climate Trend through Storm Season, Building Age, Sea Level, Storm Surge, Material Condition, Code Compliance, Flood Damage, Claim Severity, Rate Adequacy, Portfolio Loss, to Reinsurance Cost. The attribution used backward inference: evidence entered at Portfolio Loss = High and propagated upstream through the graph. The compliance intervention used the do-operator on Code Compliance, severing its edge from Building Age to isolate the effect of enforcement rather than selection. The node probabilities were elicited from your underwriting and actuarial teams. I am not generating these numbers, I am reading them from the model.The audit trail is Coastal_Property.bayes and its elicitation record, not the language model's training data.
06 Where it sits
Between the model and every component that uses it.
Inference sits at the center of the EARA stack, between the model and every component that uses it. The Evidence component feeds it: evidence is what sets the observed variables that inference propagates from. The Cognitive Primitives consume it: each of the seven reasoning operations, predict, diagnose, attribute, compare, explain, optimize, simulate, is a specific inference query under the hood. The Scenarios component runs inference repeatedly across a parameter space. The Governance Artifacts are structured records of inference results, what was asked, what direction it ran, what evidence was set, what the model returned.
Nothing in the stack answers a question without inference. It is the operation that turns a static knowledge structure into a live reasoning system.