Why a Causal Model
Bank churn analysis has a structural measurement problem at every rung. At Rung 1, three teams each have a metric that moved when churn moved — fees, app outages, branch hours — but the standard approach of correlating each with churn cannot separate their effects when economic stress and digital maturity drive multiple metrics simultaneously. At Rung 2, customer retention programs are deployed to high-risk customers, which means observed outcomes for program recipients and non-recipients are not comparable — the confound between who gets the program and who would have churned anyway is built into the data. At Rung 3, counting the customers who churned despite the campaign says nothing about the customers who would have churned without it.
| Question | Standard Approach | Causal Approach |
|---|---|---|
| Which factor drove churn? | Correlate each metric with churn rate | Diagnostic model with confounders produces posterior over causes |
| Causal effect of digital migration | Compare churn rates of migrated vs non-migrated cohorts | Intervention query severs Digital Readiness confounder; isolates migration effect |
| Did the retention campaign work? | Compare churn before and after campaign | Abduction anchors cohort background; counterfactual removes campaign |
The Questions
- Did the retention campaign actually prevent exits, or did it spend £2.4M on customers who would have stayed regardless? — Rung 3 (Counterfactual). Answering it requires abduction to anchor the targeted cohort’s background churn propensity, then removing the campaign and computing the difference; the U nodes on Churn Propensity and Economic Stress must be updated before the counterfactual is applied.
- What does forced digital migration actually cause to 18-month churn probability, separate from the fact that the most digitally ready customers are migrated first? — Rung 2 (Intervention). A do() query severs the Digital Readiness and Account Complexity confounders, isolating the causal effect of migration from the selection bias built into who gets migrated.
- Which of the three competing root causes — fees, app outages, or branch hours — actually explains the 14% churn rise? — Rung 1 (Association). The graph encodes which dependencies exist between Economic Stress, Digital Maturity, and the three operational signals; entering each team’s evidence propagates through only the connected nodes, separating what is genuinely correlated from what is spurious.
Reading the screenshots: a black check mark on a node means it has been set as observed evidence — a fact entered into the model, acting as a filter. A red check mark means it has been set as a do intervention — a decision applied to the model, severing the influence of its parents.
Reading the spec tables: each Run the Analysis block lists the exact steps to reproduce each screenshot in Bayes Server. The Obs / Do column uses three italic control tokens: clear — reset the model to a blank no-evidence state; abduction step — enter the factual observations that anchor the U nodes to this specific case; use abduction result — apply a do() intervention with the U nodes held from the abduction step.
Did the retention campaign accelerate exits it was meant to prevent?
“We spent £2.4M on a proactive retention campaign last quarter. 4,200 customers still churned. Would those customers have churned anyway — or did targeting the wrong segment actually make things worse?”
The confound in the data: high-propensity customers are targeted precisely because they score highest on the churn model. Observing that a customer received the campaign tells you the model judged them at risk — which is independently predictive of churning. The CRM Risk Score confounder drives both the targeting decision and the actual churn outcome through two separate paths.
The model uses CRM Risk Score as the observable confounder — a score set in the CRM before the campaign is deployed, so it is directly observable at the time of the counterfactual query. This matters structurally: Churn Outcome must not be entered as abduction evidence, because it is the node being queried in the counterfactual. If Churn Outcome = Churned is observed, it is clamped permanently and cannot update in the counterfactual step. Instead, abduction uses obs(CRM Risk Score = High-Risk) to anchor the background risk — which updates U_Campaign and U_Churn — leaving Churn Outcome free to compute under do(Campaign = No).
Abduction: obs(Campaign = Yes) + obs(CRM Risk Score = High-Risk). These are both known before the campaign outcome is evaluated. U_Campaign and U_Churn update; Churn Outcome stays free. Counterfactual: do(Campaign = No), U nodes held fixed. CRM Risk Score stays at High-Risk — the back-door from risk score to churn outcome remains, correctly preserving this cohort’s elevated baseline. Churn Outcome is now free to compute. Compare do(Campaign = No) against obs(Campaign = No): the obs query flows back through the back-door and infers lower CRM risk (customers who don’t receive campaigns tend to be lower-risk, so observing no campaign implies lower background risk and therefore lower churn). The gap between do() and obs() is the selection bias correction — the reason a naive comparison of churned vs retained cohorts systematically understates the campaign’s counterfactual value.
| Image | Obs / Do | Node | Set | Result |
|---|---|---|---|---|
| bc-cf-3 | — | Prior Skill Level | 30% High / 50% Moderate / 20% Low | |
| — | Training Program | 45.8% Completed / 54.2% Not Completed | ||
| — | Performance Outcome | 28.4% Exceeds / 36.2% Meets / 35.4% Below | ||
| — | Promotion Decision | 22.7% Promoted / 49.2% Retained / 28.2% At Risk | ||
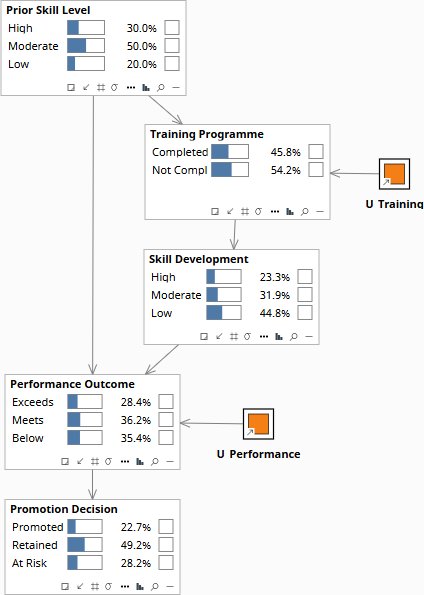
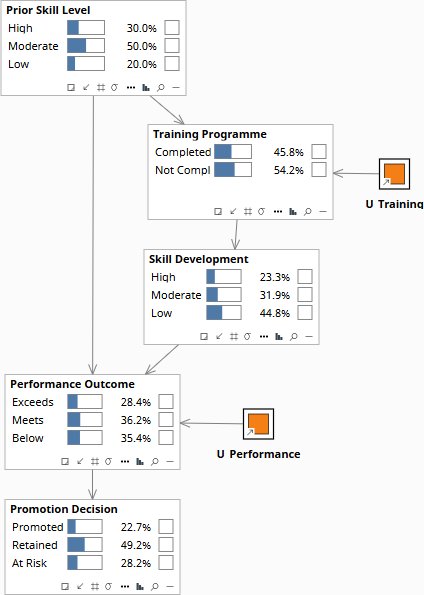
| bc-cf-0 | obs | Prior Skill Level | High | Confounder anchored; U nodes update |
| obs | Training Program | Not Completed | Factual state of this employee | |
| — | Performance Outcome | 39.7% Exceeds / 38.1% Meets / 22.2% Below | ||
| — | Promotion Decision | 29.6% Promoted / 49.4% Retained / 21.0% At Risk | ||
| bc-cf-2 | do | Training Program | Completed | Counterfactual — U posteriors held; back-door severed |
| — | Prior Skill Level | Stays at High — observed value held | ||
| — | Skill Development | 45.0% High / 40.0% Moderate / 15.0% Low | ||
| — | Performance Outcome | 56.0% Exceeds / 31.9% Meets / 12.1% Below | ||
| — | Promotion Decision | 38.8% Promoted / 46.6% Retained / 14.6% At Risk | ||
| bc-cf-1 | do | Training Program | Not Completed | do() reference — compare to obs() in step 2 |
| — | Performance Outcome | 39.7% — same as obs(); Prior Skill anchored blocks back-door |
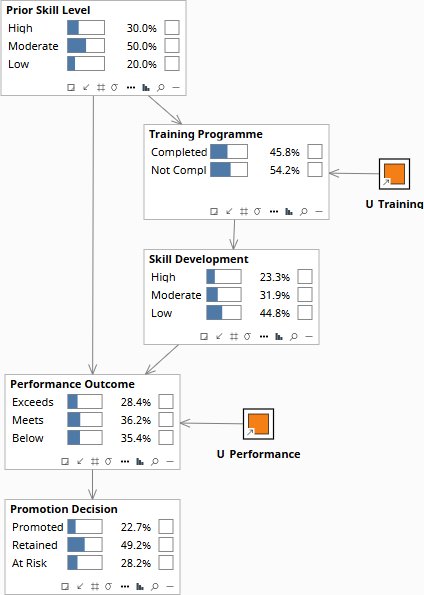
All nodes at prior. Prior Skill Level 30/50/20%. Training 45.8% Completed. Performance 28.4% Exceeds / 35.4% Below. Promotion 22.7% Promoted.
What does moving customers from branch-primary to digital-primary banking actually cause?
“If we migrate a customer segment from branch-primary to digital-primary banking to reduce cost, what does that actually do to their 18-month churn probability — separate from the fact that we tend to migrate the most digitally ready customers first?”
Customer Digital Readiness and Account Complexity are the confounders. Digitally ready customers are selected for migration first AND independently have higher churn susceptibility — they are younger, more mobile, more willing to switch. Account complexity determines both migration eligibility (complex accounts stay branch-primary longer) AND the friction experienced if migrated. Observing a migrated customer tells you the bank assessed them as digitally ready and low complexity — both of which are independently predictive of the outcome. The intervention query severs both links, asking: for an average customer across the readiness and complexity spectrum, what does migration itself cause?
Forced digital migration raises 18-month churn probability materially for moderate-complexity accounts, but the effect is heterogeneous: low-complexity high-readiness customers show minimal causal effect, while high-complexity customers show a compounded friction effect that the observed data dramatically understates. The bank has been measuring the effect on the customers it chose to migrate, not the effect migration would have on the customers it has not yet migrated — these are different populations.
| Image | Obs / Do | Node | Set | Result |
|---|---|---|---|---|
| bc-int-0 | — | Prior Skill Level | 30% High / 50% Moderate / 20% Low | |
| — | Training Program | 45.8% Completed / 54.2% Not Completed | ||
| — | Performance Outcome | 28.4% Exceeds / 36.2% Meets / 35.4% Below | ||
| — | Promotion Decision | 22.7% Promoted / 49.2% Retained / 28.2% At Risk | ||
| bc-int-1 | obs | Training Program | Completed | Back-door open — confounded estimate |
| — | Prior Skill Level | 47.5% High / 43.7% Moderate / 8.7% Low — selection inferred | ||
| — | Skill Development | 45.0% High / 40.0% Moderate / 15.0% Low | ||
| — | Performance Outcome | 41.5% Exceeds / 36.8% Meets / 21.7% Below | ||
| — | Promotion Decision | 30.6% Promoted / 48.8% Retained / 20.6% At Risk | ||
| bc-int-2 | do | Training Program | Completed | Severs Prior Skill → Training back-door |
| — | Prior Skill Level | 30% High / 50% Moderate / 20% Low — stays at prior | ||
| — | Skill Development | 45.0% High / 40.0% Moderate / 15.0% Low | ||
| — | Performance Outcome | 35.2% Exceeds / 38.1% Meets / 26.7% Below — true causal effect | ||
| — | Promotion Decision | 26.9% Promoted / 49.5% Retained / 23.5% At Risk |
All nodes at prior. Training Program 45.8% Completed. Performance Outcome 28.4% Exceeds / 35.4% Below. Prior Skill Level at population mix 30/50/20%.
Which team is right about the 14% churn rise?
“Churn is up 14% year-on-year. Product team says it is the fee increase. Digital team says it is the app outages. Relationship team says it is the reduced branch hours. What does the evidence actually support?”
Economic Stress Environment and Customer Digital Maturity are the confounders that make this diagnostic discriminate. Economic stress independently drives fee sensitivity and competitor attractiveness — so confirming significant fee impact also updates stress, which shifts competitor pull. Digital maturity independently drives both app outage impact (digitally mature customers are more reliant on the app) and branch access impact (they visit branches for complex queries). At Rung 1 the graph encodes which dependencies exist: each team’s evidence produces a different posterior footprint across the shared confounders.
No single cause dominates when only churn rate is entered — all three teams are partially right. But entering the evidence combination that best matches the observed data pattern points toward economic stress as the structural amplifier: it is making fee increases hit harder and competitor products look more attractive simultaneously, while the operational failures provide the trigger events. The right intervention is at the confounder level — economic stress management and pricing strategy — not any single operational fix.
| Image | Obs / Do | Node | Set | Result |
|---|---|---|---|---|
| bc-diag-0 | — | Prior Skill Level | 30% High / 50% Moderate / 20% Low | |
| — | Training Program | 45.8% Completed / 54.2% Not Completed | ||
| — | Skill Development | 23.3% High / 31.9% Moderate / 44.8% Low | ||
| — | Performance Outcome | 28.4% Exceeds / 36.2% Meets / 35.4% Below | ||
| — | Promotion Decision | 22.7% Promoted / 49.2% Retained / 28.2% At Risk | ||
| bc-diag-1 | obs | Performance Outcome | Below | |
| — | Prior Skill Level | 12.6% High / 51.7% Moderate / 35.7% Low — skill inferred down | ||
| — | Training Program | 28.1% Completed / 71.9% Not Completed | ||
| — | Skill Development | 9.3% High / 25.5% Moderate / 65.2% Low | ||
| — | Promotion Decision | 2.0% Promoted / 38.0% Retained / 60.0% At Risk | ||
| bc-diag-2 | obs | Performance Outcome | Below | |
| obs | Training Program | Completed | Adding training narrows the diagnosis | |
| — | Prior Skill Level | 26.4% High / 54.4% Moderate / 19.2% Low — higher than step 2 | ||
| — | Skill Development | 27.5% High / 44.4% Moderate / 28.1% Low | ||
| — | Promotion Decision | 2.0% Promoted / 38.0% Retained / 60.0% At Risk |
All nodes at prior. Performance Outcome 28.4% Exceeds / 35.4% Below. Promotion Decision 22.7% Promoted / 28.2% At Risk. Prior Skill Level 30/50/20%.
Download the Models
All models require Bayes Server (free edition available). See Download Models for the full library.
If your churn model is built on observed campaign outcomes, observed migration data, or team-level correlation analysis, it is measuring selection effects — not causes. The decisions it supports will be wrong in predictable directions.
The models are free. What I provide is the judgment to build the right structure for your specific situation, encode your experts’ knowledge into it, and turn the output into decisions your board can act on. The discipline stays with your team.