Why a Causal Model
Credit risk models face a fundamental identification problem at every rung. At Rung 1, when three teams attribute a default rate rise to different causes — macro rates, vintage quality, sector concentration — they are all partially observing the same upstream pressure. Late-cycle lending simultaneously produced lax standards and hot-sector concentration; high leverage simultaneously amplifies macro sensitivity and is itself a product of late-cycle origination. Standard regression cannot separate these. At Rung 2, early intervention programs are deployed to borrowers the bank believes are recoverable — so the observed recovery rates of intervention recipients are inflated by the pre-existing quality of who was selected. At Rung 3, covenant structures are negotiated by risk-tolerant committees who also tend to approve riskier credits, making observed covenant-default relationships confounded in both directions.
| Question | Standard Approach | Causal Approach |
|---|---|---|
| Which cause drove default rise? | Univariate regression on each factor | Confounder graph separates Origination Cycle Position and Leverage common pathways |
| Effect of early intervention | Compare recovery of enrolled vs non-enrolled | Intervention query severs Recoverability and Cooperation confounders |
| Would tighter covenants have prevented default? | Not computable from observational data | Abduction anchors U nodes; do(Covenant=Tight) isolates early warning mechanism |
The Questions
- Would tighter covenants have prevented the commercial default that occurred 14 months after approval, given what the credit committee actually knew? — Rung 3 (Counterfactual). Answering it requires abduction to anchor Credit Committee Risk Tolerance and the borrower’s actual cashflow execution before restoring the early warning mechanism; the confounder is Credit Committee Risk Tolerance, which must be fixed at its actual value before the intervention is applied.
- What does early intervention at 30-DPD actually cause to 12-month recovery rates, separate from the fact that only recoverable borrowers get enrolled? — Rung 2 (Intervention). A do() query severs the Perceived Recoverability and Borrower Cooperation confounders, isolating the causal effect of the intervention from the selection bias built into who receives it.
- Which of the three competing root causes — macro rate rises, 2021 vintage quality, or sector concentration — best explains the 22% SME default rise? — Rung 1 (Association). The graph encodes which dependencies exist between Origination Cycle Position, Portfolio Leverage, and default outcomes; entering each team’s evidence propagates through only the genuinely connected nodes.
Reading the screenshots: a black check mark on a node means it has been set as observed evidence — a fact entered into the model, acting as a filter. A red check mark means it has been set as a do intervention — a decision applied to the model, severing the influence of its parents.
Reading the spec tables: each Run the Analysis block lists the exact steps to reproduce each screenshot in Bayes Server. The Obs / Do column uses three italic control tokens: clear — reset the model to a blank no-evidence state; abduction step — enter the factual observations that anchor the U nodes to this specific case; use abduction result — apply a do() intervention with the U nodes held from the abduction step.
Would tighter covenants have prevented the default?
“A commercial borrower defaulted 14 months after approval. The credit committee flagged concentration risk but approved with light covenants. Would a tighter covenant structure have changed the outcome?”
Credit Committee Risk Tolerance is the observable confounder: it is recorded in the credit approval memo before the default, so it is known at abduction time. Risk-tolerant committees write lighter covenants AND approve riskier borrower profiles — creating a back-door path: Covenant Structure ← Risk Tolerance → Borrower Default. Abduction uses obs(Risk Tolerance = High) and obs(Covenant = Light) — both observable from the credit file — to anchor U_Covenant and U_Default to this credit’s actual background. Borrower Default is NOT observed during abduction: it is the counterfactual query node and must stay free. The counterfactual then applies do(Covenant = Tight) and asks: through the early warning mechanism, would timely intervention have broken the default chain for this specific credit profile?
The model shows that tight covenants would have provided timely early warning with high probability, and timely warning materially reduces default probability for this credit’s risk profile. However, the Management Quality direct path shows the committee also approved a riskier underlying credit — meaning tight covenants were necessary but not sufficient. The counterfactual answer: covenants would likely have prevented the default, but the real governance failure was the committee’s risk tolerance that produced both the light covenants and the marginal credit approval.
| Image | Obs / Do | Node | Set | Result |
|---|---|---|---|---|
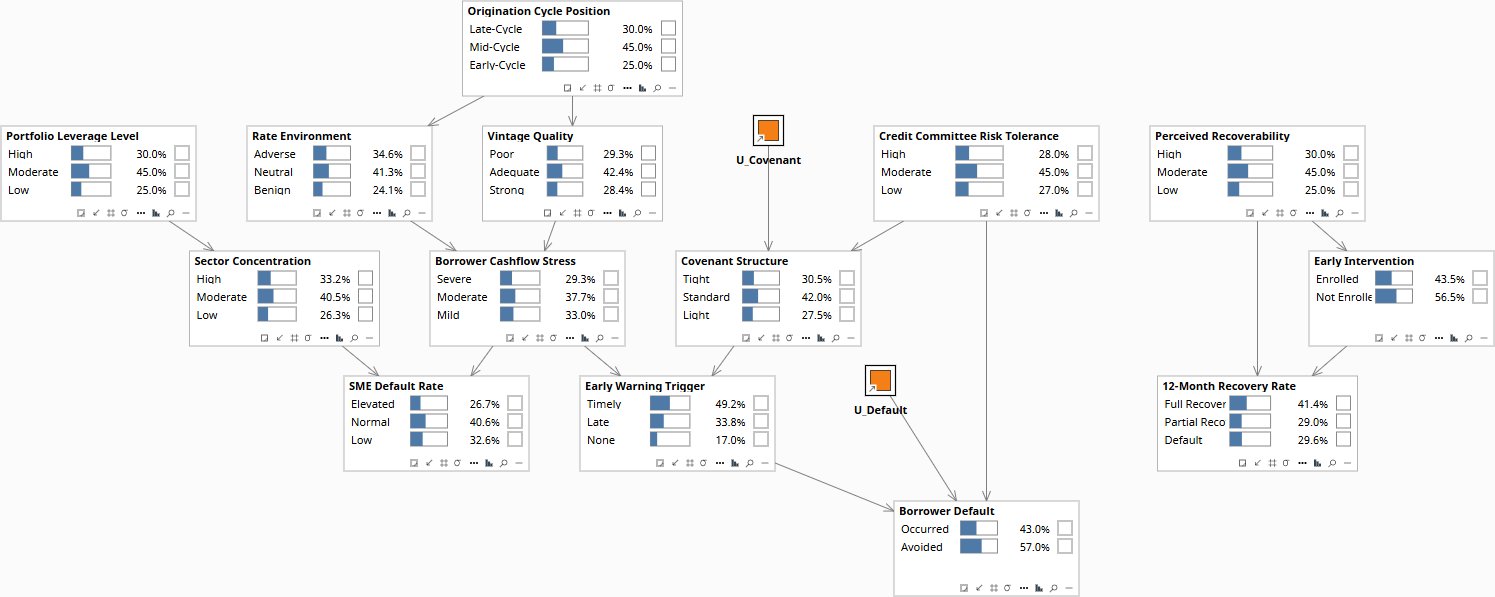
| cr-cf-0 | — | Credit Committee Risk Tolerance | 28% High / 45% Moderate / 27% Low | |
| — | Covenant Structure | 30.5% Tight / 42.0% Standard / 27.5% Light | ||
| — | Early Warning Trigger | 49.2% Timely / 33.8% Late / 17.0% None | ||
| — | Borrower Default | 43.0% Occurred / 57.0% Avoided — free; query node | ||
| cr-cf-1 | obs | Credit Committee Risk Tolerance | High | Observable confounder anchored |
| obs | Covenant Structure | Light | Observed from credit agreement | |
| — | U_Covenant, U_Default | Posteriors updated — background anchored | ||
| — | Early Warning Trigger | 19.7% Timely / 43.8% Late / 36.6% None | ||
| — | Borrower Default | 69.6% Occurred / 30.4% Avoided — free; not clamped | ||
| cr-cf-2 | do | Covenant Structure | Tight | Severs Risk Tolerance → Covenant back-door |
| — | Credit Committee Risk Tolerance | Stays at High — observed value held | ||
| — | Early Warning Trigger | 74.6% Timely / 20.3% Late / 5.1% None | ||
| — | Borrower Default | 53.2% Occurred / 46.8% Avoided — counterfactual result |

Full model at prior. Credit Committee Risk Tolerance and Covenant Structure at population base rates. Borrower Default at 43.0% — it is the counterfactual query node and is deliberately not observed during abduction.
What does early intervention at 30-DPD actually cause to recovery rates?
“If we move a borrower into an early-intervention program at 30 days past due, what does that actually cause to 12-month recovery rate — separate from the fact that we only intervene on borrowers we believe are recoverable?”
Perceived Recoverability and Borrower Cooperation are the two confounders. The bank enrolls borrowers it judges recoverable — so enrolled borrowers have both better restructuring plans (the intervention effect) AND better underlying capacity (the selection effect). Cooperative borrowers accept intervention and independently have better recovery odds. Observing high recovery in enrolled borrowers includes both. The intervention query holds recoverability and cooperation at their priors, isolating what the program itself causes across the full distribution of distressed borrowers — including those the bank currently judges unrecoverable and therefore never enrols.
The pure causal effect of enrollment — isolated from who gets enrolled — is positive but smaller than observed outcome differences suggest. The larger implication: there is a population of borrowers currently not enrolled because they score below the recoverability threshold who would benefit from earlier intervention. The selection criteria are excluding the program’s marginal cases, not just its clear failures.
| Image | Obs / Do | Node | Set | Result |
|---|---|---|---|---|
| cr-int-0 | — | Perceived Recoverability | 30% High / 45% Moderate / 25% Low | |
| — | Early Intervention | 43.5% Enrolled / 56.5% Not Enrolled | ||
| — | 12-Month Recovery Rate | 41.4% Full / 29.0% Partial / 29.6% Default | ||
| cr-int-1 | do | Early Intervention | Enrolled | Severs Perceived Recoverability back-door |
| — | Perceived Recoverability | 30% High / 45% Moderate / 25% Low — stays at prior | ||
| — | 12-Month Recovery Rate | 53.8% Full / 28.7% Partial / 17.5% Default — true causal effect | ||
| cr-int-2 | obs | Early Intervention | Enrolled | Back-door open — compare to do() |
| — | Perceived Recoverability | 51.7% High / 41.4% Moderate / 6.9% Low — selection inferred | ||
| — | 12-Month Recovery Rate | 63.8% Full / 24.1% Partial / 12.1% Default — confounded |
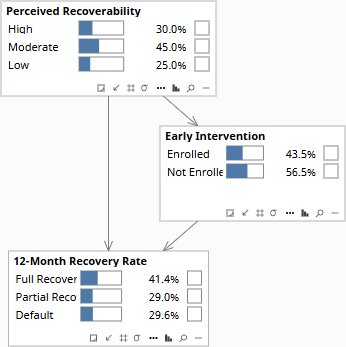
At the prior, the recovery rate distribution reflects all distressed borrowers in the portfolio — enrolled and non-enrolled alike — without selection effects applied.
Which root cause is driving the 22% SME default rise?
“Default rates in our SME portfolio are up 22%. Risk says macro rate rises are hitting cashflow. Originations says it is a 2021 vintage problem. Finance says it is sector concentration. Which cause does the evidence most support?”
Origination Cycle Position (OCP) and Portfolio Leverage Level are the confounders. Late-cycle lending simultaneously produced poor vintage quality through lax standards and high sector concentration as capital chased hot sectors. High leverage simultaneously amplifies macro rate sensitivity and was itself more common in late-cycle deals. At Rung 1, the graph encodes which dependencies exist: the three teams are not observing independent causes — confirming any one team’s evidence updates the shared confounders, which shifts the other teams’ posteriors.
With only the elevated default rate entered, all three hypotheses update modestly — no single team dominates. Adding rate environment evidence shifts OCP toward Late-Cycle, which also implicates vintage quality through the shared confounder. Adding vintage evidence similarly implicates sector concentration. The model cannot resolve the debate with the current evidence pattern — but it shows all three causes are real and compound through the same structural root: late-cycle origination under high leverage. The intervention is at the origination standard level, not any single portfolio metric.
| Image | Obs / Do | Node | Set | Result |
|---|---|---|---|---|
| cr-diag-0 | — | Origination Cycle Position | 30% Late / 45% Mid / 25% Early | |
| — | Portfolio Leverage Level | 30% High / 45% Moderate / 25% Low | ||
| — | SME Default Rate | 26.7% Elevated / 40.6% Normal / 32.6% Low | ||
| — | Borrower Cashflow Stress | 29.3% Severe / 37.7% Moderate / 33.0% Mild | ||
| cr-diag-1 | obs | SME Default Rate | Elevated | |
| — | Origination Cycle Position | 39.6% Late-Cycle / 43.1% Mid / 17.3% Early | ||
| — | Portfolio Leverage Level | 37.7% High / 44.3% Moderate / 18.0% Low | ||
| — | Borrower Cashflow Stress | 59.6% Severe / 31.0% Moderate / 9.4% Mild | ||
| cr-diag-2 | obs | Rate Environment | Adverse | |
| — | Origination Cycle Position | 56.4% Late-Cycle — amplifies from 39.6% | ||
| — | Vintage Quality | 41.3% Poor / 40.6% Adequate — co-moves via OCP | ||
| — | Borrower Cashflow Stress | 54.3% Severe / 32.5% Moderate / 13.2% Mild | ||
| cr-diag-3 | obs | Vintage Quality | Poor | |
| — | Origination Cycle Position | 59.4% Late-Cycle — further amplifies | ||
| — | Rate Environment | 48.7% Adverse / 36.8% Neutral — co-moves via OCP | ||
| — | Borrower Cashflow Stress | 52.7% Severe / 33.1% Moderate / 14.2% Mild |
Before any evidence is entered, the three competing root causes — macro rates, vintage quality, and sector concentration — hold roughly equal weight in the population prior.
Download the Models
All models require Bayes Server (free edition available). See Download Models for the full library.
If your credit risk function is measuring intervention effectiveness on enrolled borrowers, covenant adequacy on approved credits, and default attribution on portfolio averages, it is answering the easy versions of those questions — not the ones that matter for the decisions you are actually making.
The models are free. What I provide is the judgment to build the right structure for your specific situation, encode your experts’ knowledge into it, and turn the output into decisions your board can act on. The discipline stays with your team.