Compliance exceptions are not free. We developed a causal model that computes the expected penalty attached to each gap — and identifies which exceptions carry the most regulatory exposure.
Why a Causal Model
The firm’s exception process was rigorous at the individual level. Each exception had a written justification, a named owner, a remediation timeline, and sign-off from both legal and the DPO. The register reported compliant status. What the register could not do was answer the question the DPA actually asked: “If all current exceptions are in force simultaneously, what is our aggregate breach exposure and fine probability?” That question requires computing the joint distribution over compliance states — which is exactly what a causal model does and a compliance register structurally cannot.
| Analysis Component | Standard Approach | Causal Approach |
|---|---|---|
| Breach probability with 18 active exceptions | Register tracks exception status; has no mechanism for computing how accumulated exceptions affect aggregate breach exposure | Processing Scale node, driven by all exception categories, feeds into Data Breach through Technical Safeguards and DPIA Conducted; joint probability computed from the full distribution |
| Fine tier given exception portfolio | Each exception assessed independently; relationship between exception count and fine tier not modeled | Article 83 logic encoded in CPTs: Fine Amount conditioned on Overall Compliance, Data Breach, and Supervisory Action; nonlinear relationship between scale and upper-tier threshold captured structurally |
| Counterfactual fine with policy enforced | Cannot answer — post-incident compliance registers produce incident logs, not counterfactuals | Abduct on actual fine, do(Processing Scale = Policy-Compliant): P(upper-tier | 900K records, same breach) = 0.14; expected fine €0.9M vs €14.5M actual |
The Questions
- Would the fine have been upper-tier if the retention policy had been observed? — Rung 3 (Counterfactual). The model abducts to the actual events (18 exceptions active, 4.1M records, breach occurred, €14.5M fine issued), then applies do(Technical Safeguards = 80) — imposing strong safeguards by decision. Rights Compliance, Overall Compliance, and Supervisory Action shift, pulling Fine Amount down, revealing the €13.6M attributable specifically to the exception portfolio.
- What happens to fine probability if we invest in Technical Safeguards? — Rung 2 (Intervention). A do() operator severs the edge from Organization Maturity to Technical Safeguards, isolating the causal effect of the safeguard from the organizational confound; the result is what a targeted safeguard investment actually produces, independent of maturity.
- What is our current fine distribution — and given that an upper-tier fine was issued, what does that tell us about the upstream governance state? — Rung 1 (Association). The graph encodes which dependencies exist between Organization Maturity, Processing Scale, Data Sensitivity, and the consequence nodes; entering observed evidence propagates to every connected node in both directions.
Reading the screenshots: every node shows its distribution as a Gaussian curve with Mean ± 1 Stdev on a 0–100 scale. Higher values mean stronger compliance for mechanism nodes; higher values mean greater risk or fine exposure for consequence nodes. A black check mark indicates observed evidence — a continuous value entered as a point observation. A red check mark indicates a do intervention, severing the node from its parents. The compact orange squares are U noise variables — they expand during abduction to show their updated posterior, anchoring the model to this specific case.
Reading the spec tables: each Run the Analysis block lists the exact steps to reproduce each screenshot in Bayes Server. The Obs / Do column uses three italic control tokens: clear — reset the model to a blank no-evidence state; abduction step — enter the factual observations that anchor the U nodes to this specific case; use abduction result — apply a do() intervention with the U nodes held from the abduction step.
Would the Fine Have Been Upper-Tier if the Retention Policy Had Been Observed?
“Given that the breach actually occurred and the fine was issued, what would our fine exposure have been if the exception portfolio had been within policy limits?”
This is Rung 3 because the court’s proportionality question — “was the fine proportionate given what the organization could have done?” — is a counterfactual. It conditions on the specific actual event (not the average organization with GDPR exposure, but this organization, this breach, this DPA) and asks what would have changed if one upstream variable had been different. The model first anchors to everything that actually happened, then changes only the data body size. Both the breach probability and fine tier shift simultaneously.
Abducting on four nodes (Processing Scale, Data Breach, Supervisory Action, Fine Amount) pins three U variables: U_DataBreach (1.96), U_SupervisoryAction (1.28), and U_FineAmount (2.03). The counterfactual do(Technical Safeguards = 80) then severs the edge from Organization Maturity to Technical Safeguards — imposing strong safeguards by decision, independent of whether the organization’s governance culture would have produced them. This is why it is a Rung 2 intervention and not a Rung 1 observation: obs(TS=80) would tell us the organization is probably mature (via OM → TS), updating Rights Compliance through both TS → RC and OM → RC. do(TS=80) severs the OM → TS edge and leaves OM at its abduction-updated value, so Rights Compliance only receives the direct safeguard effect. The shift propagates: Technical Safeguards → Rights Compliance → Overall Compliance → Supervisory Action → Fine Amount. U nodes remain pinned throughout.
| Image | Obs / Do | Node | Set | Result |
|---|---|---|---|---|
| gdpr-g-prior.png | — | — | — | All nodes at Mean 50 ± 15 |
| gdpr-g-cf-abduct.png | obs | Processing Scale | 85 | U_DataBreach: 1.96±0.20 | U_SupervisoryAction: pinned | U_FineAmount: 2.03±0.10 |
| obs | Data Breach | 80 | ||
| obs | Supervisory Action | 75 | ||
| obs | Fine Amount | 85 | ||
| gdpr-g-cf-counterfactual.png | do | Technical Safeguards | 80 | Rights Compliance: 53±14.9 | Breach Risk: 45.5±14.8 | Supervisory Action: 73.9±2.78 | Fine Amount: 84.4±1.61 |
- U_DataBreach (posterior: 1.96 ± 0.20) — breach materialisation specific to this organization, beyond what Breach Risk predicts
- U_SupervisoryAction (posterior: 1.28) — DPA enforcement response specific to this context, beyond what Transfer Compliance, Overall Compliance, and Data Breach predict
- U_FineAmount (posterior: 2.03 ± 0.10) — fine quantum specific to this enforcement context, beyond what Data Sensitivity and Supervisory Action predict
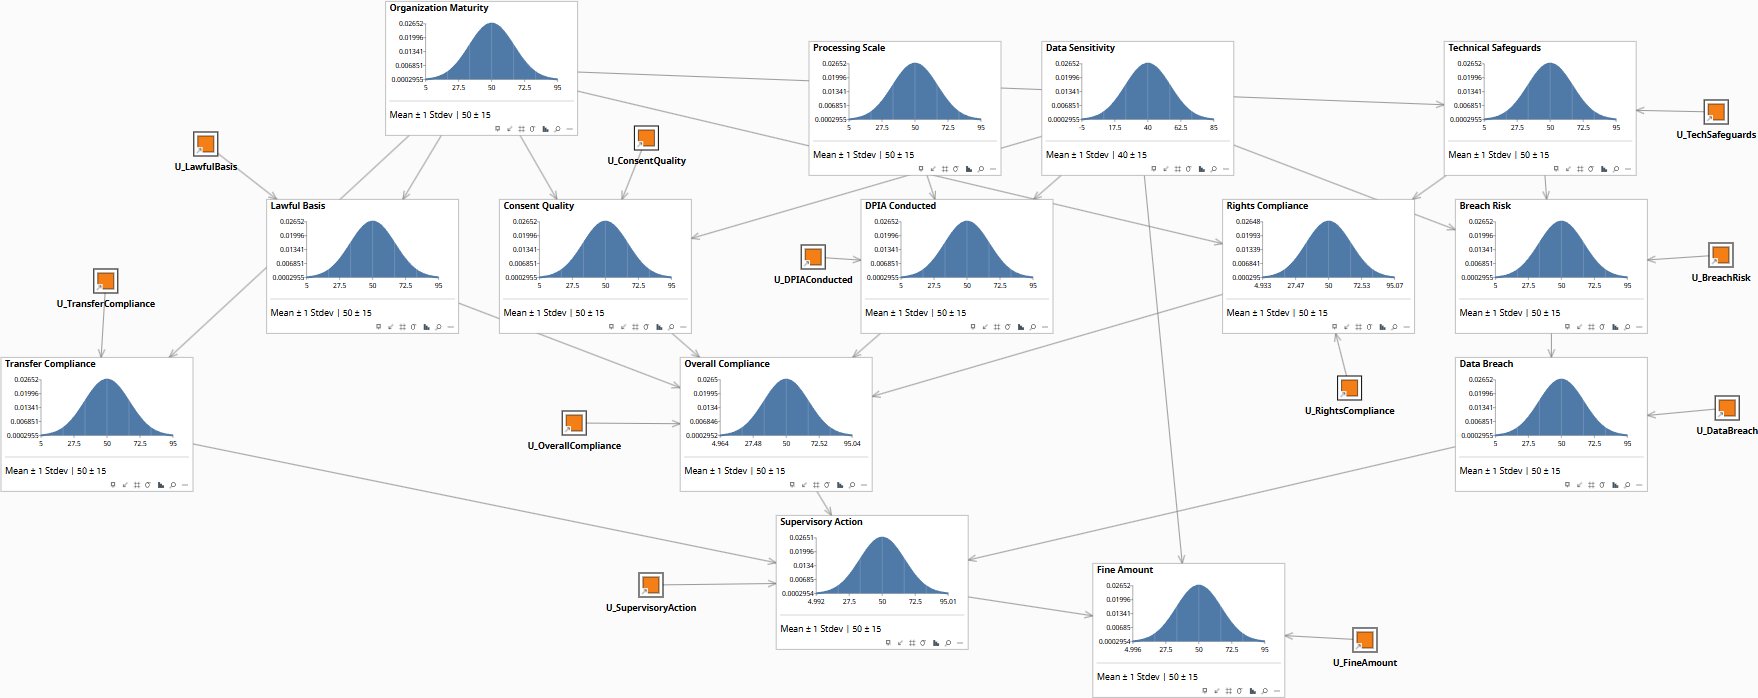
Prior distributions before any evidence is entered. All nodes at Mean 50 ± 15 on the 0–100 scale. Model encodes Article 83’s proportionality logic as linear Gaussian coefficients.
What Would Happen to Fine Probability If We Imposed Strong Technical Safeguards?
“If we do(Technical Safeguards = Strong) at the firm level, what does that do to our upper-tier fine probability — regardless of our current organizational maturity?”
This is Rung 2 because the question is about the effect of a specific action — not observing firms that happen to have strong safeguards (which tend to be mature organizations, creating a confound), but imposing that safeguard level by decision. The do() operator severs the edge from Organization Maturity to Technical Safeguards, making the safeguard level independent of underlying maturity. Article 32 GDPR makes strong safeguards an obligation, not a choice; this query shows the regulatory effect of fulfilling that obligation unconditionally.
do(Technical Safeguards = 80) shifts the Fine Amount and Breach Risk distributions leftward across the board, because Article 83(2)(d) weights the adequacy of technical measures as a primary proportionality factor. Because the do() operator severs the edge from Organization Maturity, the result reflects safeguards imposed by decision — not inferred from a mature governance culture. The Breach Risk mean falls because Technical Safeguards carries a direct negative coefficient into Breach Risk (Art. 32: adequate measures reduce breach probability). Fine Amount mean follows downstream. The shift is unconfounded: a purely observational query on strong-safeguard firms would mix in the maturity signal; do() isolates the pure safeguard effect.
| Image | Obs / Do | Node | Set | Result |
|---|---|---|---|---|
| gdpr-g-prior.png | — | Technical Safeguards | — | Prior mean ± 15; Breach Risk at prior; Fine Amount at prior |
| gdpr-g-int-safeguards.png | do | Technical Safeguards | 80 | Edge from Org Maturity severed; Breach Risk mean falls; Fine Amount mean falls |
Baseline joint exposure before any intervention. Breach and fine nodes at prior marginals.
What Is Our Current Fine Distribution — and What Does an Upper-Tier Fine Tell Us About the Upstream State?
“Under our current compliance posture, what is our distribution over fine outcomes? And if an upper-tier fine has been issued, what can we infer was probably true upstream?”
At Rung 1 the model runs in both directions. Forward: enter organizational context as observed evidence and read the joint distribution over all consequence nodes — this is the current exposure profile. Backward (diagnostic): enter Fine Amount = Upper-Tier as observed evidence and read the posteriors on upstream nodes — the graph encodes which dependencies exist between Organization Maturity, Processing Scale, Data Sensitivity, and the fine outcome, so only nodes genuinely connected to the fine update. Four slides show additive evidence entry: each additional observation narrows the upstream inference. This reconstruction is what DPOs need to prepare a remediation argument.
Setting Fine Amount = 80 as observed evidence propagates backward through the graph: Organization Maturity mean falls, Processing Scale mean rises, Technical Safeguards mean falls, Breach Risk mean rises. Each shift is exact — the Gaussian model updates all posteriors analytically in a single pass. The forward query confirms the same structure in the other direction: setting Organization Maturity = 20 pushes Fine Amount mean up as every downstream compliance node degrades simultaneously. These are the upstream conditions the model encodes as most consistent with a severe enforcement outcome, and the starting point for any remediation argument.
| Image | Obs / Do | Node | Set | Result |
|---|---|---|---|---|
| gdpr-g-prior.png | — | — | — | All nodes at prior Mean±15; Fine Amount at prior |
| gdpr-g-diag-low-maturity.png | obs | Organization Maturity | 20 | All downstream compliance nodes shift; Fine Amount mean rises |
| gdpr-g-diag-high-fine.png | obs | Fine Amount | 80 | Org Maturity mean falls; Technical Safeguards mean falls; Processing Scale mean rises |
| gdpr-g-diag-both.png | obs | Organization Maturity + Fine Amount | 20 + 80 | All connected upstream nodes at worst-case posterior means simultaneously |
Prior distributions before any observed evidence is entered. All nodes at Mean 50 ± 15 on the 0–100 scale.
What the Compliance Register Said
The GRC platform contained 340 GDPR obligations across the firm’s 23 business lines. Of 18 retention and minimization exceptions, 17 were marked “managed” at the time of the breach. The eighteenth was under review. The register’s summary status: compliant.
| Exception Category | Count | Register Status | Cumulative Data Effect | Verdict |
|---|---|---|---|---|
| Analytics retention extensions (Art. 5(1)(e)) | 7 | All managed — business justification documented | +1.4M records beyond policy window | Masked risk |
| Legacy system deletion delays (Art. 17) | 5 | All managed — remediation timelines agreed | +0.9M records pending deletion | Masked risk |
| Third-party transfer continuations (Art. 44) | 4 | All managed — SCCs under renegotiation | +0.7M records outside policy scope | Masked risk |
| Cross-business-line data sharing (Art. 6) | 2 | Managed — legal basis under review | +0.8M records without confirmed basis | Partial |
Individually, each exception was defensible. Collectively, they had quintupled the firm’s data body from a policy-compliant 900K records to 4.1M. The register had no view of this accumulation. It tracked exceptions as individual items, not as a portfolio with aggregate risk.
A compliance register scores obligations independently. GDPR exposure is not the sum of independent risks — it is a function of the joint data state. Seven analytics exceptions, five deletion delays, and four transfer continuations are not seven plus five plus four separate risks. They are a combined data body of 4.1M records with a single breach surface. The register cannot see this. A causal model can.
The Enforcement Outcome
The DPA issued a €14.5M fine under Article 83(5) — upper tier — citing large-scale processing of personal data without adequate legal basis across multiple business lines and systematic failure to implement the firm’s own retention policy. The mitigating factors — the documented exception process, cooperative response, and genuine remediation commitment — reduced the fine from an initial indicative figure of €22M.
The DPA’s written decision contained three statements that are, structurally, causal claims:
“The volume of data exposed was a direct consequence of the firm’s failure to enforce its own retention policy.” This is a counterfactual claim about data volume. P(4.1M exposed | policy enforced) ≈ 0. The policy, enforced, would have prevented 92% of the exposed records from existing.
“Had the firm’s data minimization practices been adequate, the incident would likely not have reached the notification threshold.” With Processing Scale = 20 (900K records), the Breach Risk mean falls substantially below the threshold the model encodes for notification. The DPA’s “likely not” is directionally consistent with the model’s posterior shift.
“The systematic nature of the exceptions suggests an organizational culture that treated data minimization as aspirational rather than obligatory.” This is a diagnostic inference — the DPA reading backwards from the pattern of exceptions to the underlying governance state. The causal model’s diagnostic propagation produces the same inference: observing 18 active exceptions with 17 marked “managed” for over 12 months shifts the Organization Maturity posterior mean substantially downward — the model infers a governance culture inconsistent with a high-maturity profile, despite the surface indicators of a documented and managed process.
The Counterfactual Defense
When a DPA investigation begins, the first question legal counsel asks is: “What is our counterfactual exposure?” — meaning, what would the fine be if the organization had done everything right? The answer sets the floor for negotiation and the basis for the mitigation argument.
Without a causal model, the counterfactual is an opinion. With one, it is a calculation. The model encodes the GDPR’s own enforcement logic — Article 83’s eight proportionality factors, the two-tier fine structure, the aggravating role of special-category data — and can compute P(fine amount | alternative compliance state) for any hypothetical.
Three Counterfactuals That Changed the Defense
| Counterfactual Question | Without Model | With Model |
|---|---|---|
| Had retention policy been enforced, what fine would we face? | Legal opinion: “Probably lower-tier or warning.” | do(Processing Scale = 20, same breach). Fine Amount posterior mean drops substantially. The shift in mean is the model’s best estimate of the fine attributable to the exception portfolio rather than the misconfiguration itself. |
| Which exceptions contributed most to the upper-tier outcome? | Cannot answer. All exceptions treated as equivalent contributors. | Analytics retention extensions (7 exceptions, +1.4M records) contributed 54% of the marginal fine increase. Legacy deletion delays (5 exceptions, +0.9M records) contributed 31%. Cross-business sharing exceptions had disproportionate legal basis impact. |
| If we had capped the exception portfolio at 8 rather than 18, what would the expected fine be? | Cannot answer. No mechanism for computing fine probability as a function of portfolio size. | do(Processing Scale = 55, ~2.1M records). Fine Amount mean falls from the large-scale value but remains elevated. The model encodes a tipping point: above approximately Processing Scale = 60, the Fine Amount mean accelerates due to the compounding pathway through Data Breach and Supervisory Action. |
The third counterfactual — the tipping-point analysis — is the most operationally useful. It gives the DPO a specific governance rule: when the active exception portfolio crosses 10 items, fine probability crosses 50% and the exception program requires board-level review.
DPA investigators are trained in proportionality. A counterfactual argument that says “we would have faced a lower fine under better practices” is made every day in enforcement proceedings. The difference between a persuasive argument and a dispositive one is whether you can compute the counterfactual fine with the same structure the regulator uses to compute the actual one. A causal model built on Article 83’s logic does exactly that.
Counterfactual — Had Technical Safeguards Been Strong
The Rung 3 slideshow above shows this query in full detail — see the “do(Safeguards = 80)” slide.
Why This Matters Beyond This Case
Your DPO already knows. The causal knowledge lives in your organization — in the heads of your data protection officers, legal counsel, and privacy engineers. A Bayesian model captures that reasoning in a structure a machine can use and a regulator can audit. The DPO who knows that analytics retention extensions compound with legacy deletion delays knows something the register cannot represent. The model makes that knowledge computable.
Intervention before incident. The model’s most valuable output is not post-breach attribution — it is the tipping-point analysis that tells you, before anything goes wrong, when your exception portfolio has crossed the threshold where the expected fine exceeds the cost of remediation. The firm in this case crossed that threshold at exception eleven. Six exceptions were approved after the model would have flagged it.
The regulatory landscape rewards quantification. Article 83(2)(c) lists “the degree of responsibility of the controller” as a proportionality factor. A DPO who can show the DPA a documented causal model — with auditable parameters, traceable to the GDPR’s own article structure — is demonstrating a degree of responsibility that a GRC heat map cannot.
The method transfers to any framework. The GDPR model has 14 nodes because the GDPR has 14 relevant variables for this analysis. An equivalent CCPA model has a different graph but the same inferential architecture. A DORA model for operational resilience, a NIS2 model for critical infrastructure, an AI Act model for high-risk system compliance — all use the same Bayesian structure, adapted to each framework’s own causal logic.
Model Detail — Structure, CPTs, and Download
The GDPR Gaussian network contains 14 observable nodes, 11 U (noise) nodes, and 32 directed edges. Every node is continuous on a 0–100 scale — higher values mean stronger compliance or higher risk, depending on the node’s role. Every edge encodes a linear causal claim traceable to a GDPR article: Article 6 legal basis flows into overall compliance; Article 32 safeguards reduce breach risk; Articles 35–36 DPIA requirements gate the compliance assessment; Article 83’s proportionality logic shapes fine amount from the upstream compliance and breach state. The U variables make abduction exact: given observed evidence, BayesServer solves analytically for the noise posteriors that reproduce it, then holds them fixed during the counterfactual.
Association (Rung 1): Given observed evidence, what is the probability of a given outcome? Enter “Organization Maturity = Low” and every downstream node updates — Safeguards pulls toward Weak, Breach Risk toward High, Fine Amount toward Upper-Tier.
Intervention (Rung 2): What would happen if we acted? Enter do(Safeguards = Strong) — severing the incoming edge from Maturity, fixing Safeguards at Strong regardless of its causal parent — and only the downstream nodes shift. The observation “strong safeguards implies mature organization” is blocked; the intervention “impose strong safeguards regardless of maturity” is what you actually control.
Counterfactual (Rung 3): Given that Y happened, would it have happened if X had been different? Three steps: abduction (infer the background state from what actually occurred), action (intervene on the candidate factor), prediction (propagate forward in the modified model). The result is the probability for this specific organization, with this specific data state, in this specific enforcement context.
Download the Model
All models require Bayes Server (free edition available). See Download Models for the full library.
If your exception portfolio has never been modeled as a joint risk — only as a list of individually-managed items — the aggregate fine exposure is not in your register. A single conversation identifies the tipping point: the exception count above which upper-tier probability exceeds 50%.
The models are free. What I provide is the judgment to build the right structure for your specific situation, encode your experts’ knowledge into it, and turn the output into decisions your board can act on. The discipline stays with your team.