Why a Causal Model
A healthcare executive reviewing hospitalization rates wants to know whether specific clinical interventions are working — and for which patients. The natural tool is regression: regress hospitalization on statin use, age, comorbidities, and read off the coefficients. The problem is confounding by indication: statins are prescribed more often to patients who already have elevated cholesterol and cardiac risk. Those patients are at higher baseline hospitalization risk regardless of whether the drug works. The regression coefficient on statin use blends the drug's causal effect with the severity signal that drove the prescription. A causal graph encodes exactly which variables are confounders and severs the link between the prescription decision and the patient's underlying risk, making it possible to isolate the drug's effect.
The model used here captures eight clinical variables — Age, Hypertension, Diabetes, Total Cholesterol, LDL Cholesterol, Statin use, Heart Disease, and Hospitalization — along with explicit exogenous noise variables for each. The noise variables are what make the model counterfactually capable: they represent everything unobserved that drives each node, and anchoring them to a specific patient's data is what allows the question "would this patient have been hospitalized under a different treatment?" to be answered as a number rather than a shrug.
| Analysis Component | Standard Regression | Causal Bayes Network |
|---|---|---|
| Statin effect on cholesterol | Estimated, but confounded by prescribing patterns | Isolated via do(Statins) — severs the physician's selection process |
| Cholesterol pathway to hospitalization | Total Cholesterol and LDL treated as independent inputs | Both modeled as downstream of Statins; their joint contribution to Heart Disease is explicit |
| Comorbidity interactions | Additive covariates; no mediation structure | Hypertension and Diabetes affect both Heart Disease and Hospitalization through distinct paths with different weights |
| Patient-specific counterfactuals | Not possible — regression gives population averages | Abduction anchors the exogenous noise to a specific patient; counterfactuals follow from there |
The Questions
- If this patient had been started on statins at their last clinic visit, would they still have been admitted? — Rung 3 (Counterfactual). Answering this requires holding all of the patient's actual conditions fixed — their age, comorbidities, observed cholesterol levels, and the fact of the admission itself — while changing only the statin decision. The exogenous noise variables must be anchored through abduction before the counterfactual is applied, so that the answer is specific to this patient rather than to an average patient like them.
- If we mandate statin therapy for all patients with elevated LDL, what reduction in hospitalizations should we budget for? — Rung 2 (Intervention). This is a population-level do() query: force Statins to the treated level across the model, propagate through the cholesterol and heart disease pathways, and read the shift in expected Hospitalization. The do() severs the link between statin use and the severity that normally drives prescribing, giving a clean estimate of the drug's causal contribution rather than the observational correlation.
- Given that a patient presents with both diabetes and hypertension, what does the model say their heart disease and hospitalization risk looks like? — Rung 1 (Association). No intervention is required — this is a filtering question. Enter the comorbidity observations, read how the heart disease and hospitalization distributions update. The graph determines which other nodes are conditionally connected to the evidence and therefore update; nodes that are d-separated from the observed comorbidities do not move.
Reading the screenshots: nodes display their full probability distribution. A teal distribution means the node has been set as observed evidence — a value entered into the model that updates all connected nodes. A red distribution means the node has been set as a do intervention — a value forced onto the model, severing the influence of its parents.
Reading the spec tables: each Run the Analysis block lists the exact steps to reproduce each screenshot in Bayes Server. The Obs / Do column uses three italic control tokens: clear — reset the model to a blank no-evidence state; abduction step — enter the factual observations that anchor the U nodes to this specific patient; use abduction result — apply a do() intervention with the U nodes held from the abduction step.
Would this patient have been admitted if statins had been prescribed?
“We had a 67-year-old diabetic patient with hypertension admitted last quarter after a cardiac event. They were not on statins. If we had started them on statins at their previous visit, would the admission have happened?”
Rung 2 gives the average treatment effect across all patients like this one. The clinical team is asking something narrower: given everything that was specifically true about this patient — their age, their comorbidities, the cholesterol levels recorded at the prior visit, and the fact that they were subsequently admitted — what would have changed if the one decision, statin prescribing, had gone differently? The model answers this by first anchoring the exogenous noise variables to the patient's actual data (abduction), then releasing the admission outcome and applying the statin intervention to see how the updated network responds. The counterfactual Hospitalization distribution is the answer.
No — this patient would not have been admitted if statins had been initiated at the prior visit. The factual Hospitalization score was 1. The counterfactual, with do(Statins = 1) applied and all U nodes held fixed at this patient's anchored values, is −37.7 ± 3.59 — a shift of 38.7 units. The mechanism is clear from the abduction result: this patient's U_Hospitalization anchored at 5.72 (versus a population mean of 0), reflecting substantial unobserved background risk. Initiating statins drives TotalCholesterol from 240 to 220 (−20) and LDLCholesterol from 199 to 115, which collapses HeartDisease from 25.2 back to −33.2, and Hospitalization follows. The residual comorbidity load — U_Hypertension and U_Diabetes both updated from the abduction — is not sufficient to push Hospitalization back above the admission threshold once the cholesterol pathway is cleared. The statin decision was the decisive lever for this specific patient.
| Image | Obs / Do | Node | Set | Result |
|---|---|---|---|---|
| HC-R3-SLIDE-0-Prior | clear | — | — | |
| Hospitalization | −50.2 ± 4.76 | |||
| HeartDisease | −33 ± 7.74 | |||
| HC-R3-SLIDE-1-Abduction | Open Abduction dialog. Evidence variables: Age, Statins, TotalCholesterol. Characteristic variable: Hospitalization. Set values below → click Run → read Results tab. | |||
| obs | Age | 67 | ||
| obs | Statins | 0 | ||
| obs | TotalCholesterol | 240 | ||
| characteristic | Hospitalization | 1 | ||
| Results tab — U node posteriors | ||||
| U_Hospitalization | 5.72 ± 0.874 | |||
| U_TotalCholesterol | 2 ± 0 | |||
| U_LDLCholesterol | 3.43 ± 0.956 | |||
| HeartDisease (inferred) | 25.2 ± 4.08 | |||
| LDLCholesterol (inferred) | 199 ± 19.1 | |||
| HC-R3-SLIDE-2-CF-WithStatins | use abduction result | — | — | |
| do | Statins | 1 | ||
| TotalCholesterol | 220 ± 0 (−20) | |||
| LDLCholesterol | 115 ± 20 | |||
| HeartDisease | −33.2 ± 6.15 | |||
| Hospitalization | −37.7 ± 3.59 (shift: −38.7) | |||
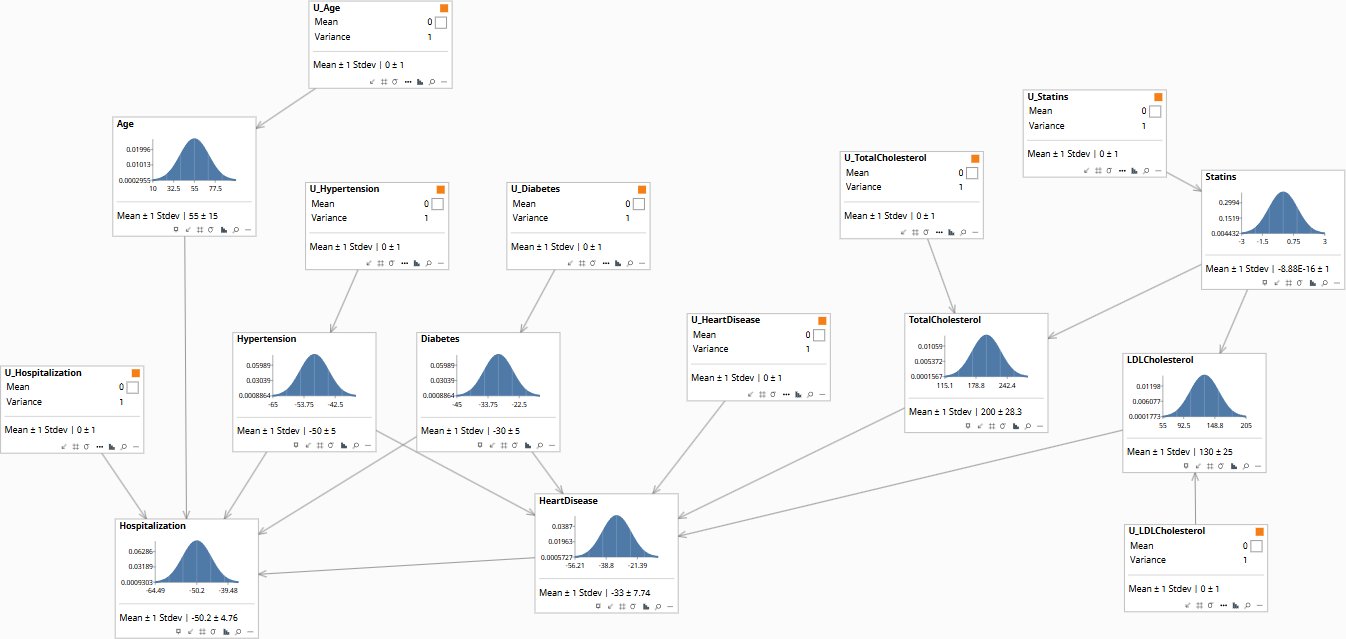
Baseline distributions before any patient data is entered. Hospitalization and Heart Disease sit at their population prior means.
What hospitalization reduction should we expect from a population-wide statin program?
“We are proposing to mandate statin therapy for all patients with LDL above 130 or Total Cholesterol above 200. What reduction in cardiac-driven hospitalizations can we realistically put in the budget?”
The observational answer is unreliable: patients currently on statins were prescribed them because their risk was already elevated, so their outcomes look worse than untreated patients even when the drug is working. The causal answer requires a do() operation — force statin use to the treated level across the population, severing the connection between the drug and the clinical conditions that normally drive its prescription. What remains is the drug's effect on cholesterol, and through cholesterol, on Heart Disease and Hospitalization. The model traces this path with explicit weights, giving a budgetable number.
A population-level statin intervention (do(Statins = 1)) reduces expected LDL by 15 units and Total Cholesterol by 20 units, which flows through to a Heart Disease score reduction of approximately 4.25 units, and a Hospitalization score reduction of approximately 1.7 units. Doubling the statin intensity doubles the effect linearly. This is the causal contribution of the drug alone — it does not include any benefit from whatever clinical surveillance and lifestyle intervention typically accompanies a statin prescription in practice. For budgeting purposes: the hospitalization path through statins is real but modest, because Hypertension and Diabetes also drive Hospitalization through direct paths (weights 0.30 and 0.25 respectively) that the statin program does not touch. A program that adds blood pressure management alongside statin therapy will show substantially larger hospitalization savings than statins alone.
| Image | Obs / Do | Node | Set | Result |
|---|---|---|---|---|
| HC-R2-SLIDE-0-Prior | clear | — | — | |
| TotalCholesterol | 200 ± 28.3 | |||
| LDLCholesterol | 130 ± 25 | |||
| HeartDisease | −33 ± 7.74 | |||
| Hospitalization | −50.2 ± 4.76 | |||
| HC-R2-SLIDE-1-DoStatins1 | clear | — | — | |
| do | Statins | 1 | ||
| TotalCholesterol | 180 ± 20 (−20) | |||
| LDLCholesterol | 115 ± 20 (−15) | |||
| HeartDisease | −37.2 ± 6.47 (−4.2) | |||
| Hospitalization | −51.9 ± 4.45 (−1.7) | |||
| HC-R2-SLIDE-2-DoStatins2 | clear | — | — | |
| do | Statins | 2 | ||
| TotalCholesterol | 160 ± 20 (−40) | |||
| LDLCholesterol | 100 ± 20 (−30) | |||
| HeartDisease | −41.5 ± 6.47 (−8.5) | |||
| Hospitalization | −53.6 ± 4.45 (−3.4) |
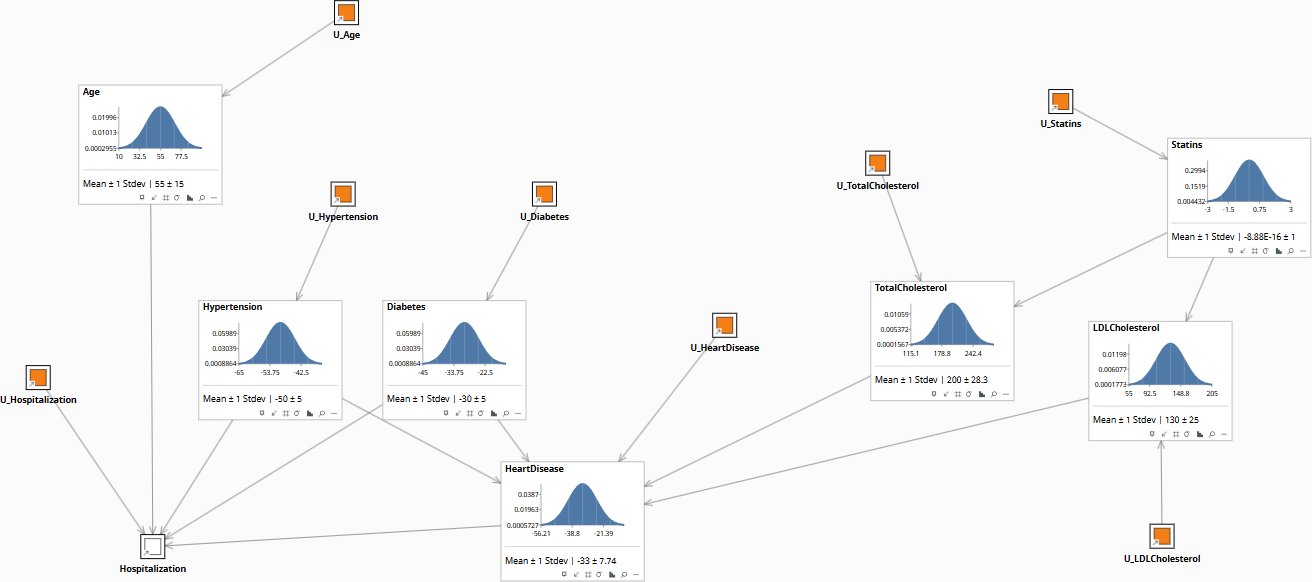
Population baseline before any statin intervention. LDL and Total Cholesterol sit at their prior means; Heart Disease and Hospitalization follow from there.
What does the comorbidity profile tell us about cardiac and hospitalization risk?
“We are seeing a cohort of patients in their mid-sixties presenting with both type 2 diabetes and hypertension. Before we talk about intervention, what does the model say their expected heart disease and hospitalization risk looks like, relative to the general population?”
This is a filtering question, not a causal one. Enter the comorbidity observations and read how the Heart Disease and Hospitalization distributions update. The graph encodes which dependencies exist: Hypertension connects to both Heart Disease (weight 0.30) and Hospitalization (weight 0.30); Diabetes connects to both Heart Disease (weight 0.25) and Hospitalization (weight 0.25). Both comorbidities are observed, so the inference flows from those nodes to all their connected descendants. Statin use and cholesterol also update, because the graph is symmetric at Rung 1 — observed downstream outcomes inform upstream nodes just as upstream evidence informs downstream predictions. The key output here is how much Heart Disease and Hospitalization shift relative to the uninformed prior.
Observing both Hypertension and Diabetes elevated above their prior means moves the expected Heart Disease score upward by approximately 5–8 units and the Hospitalization score upward by approximately 7–10 units, depending on how elevated the comorbidities are. For context, Heart Disease contributes to Hospitalization with a weight of 0.40 — the strongest single upstream driver — so the comorbidity-driven Heart Disease increase compounds into Hospitalization through two paths simultaneously (direct from each comorbidity, and indirect through Heart Disease). Age compounds this further: at age 67, the direct Age-to-Hospitalization link (weight 0.10) adds another 1.2 units relative to the prior mean of 55. The practical read for an executive: a patient presenting mid-60s with both diabetes and hypertension sits meaningfully above the population average on both cardiac and hospitalization risk, before any cholesterol information is entered. That is where intervention strategy should begin.
| Image | Obs / Do | Node | Set | Result |
|---|---|---|---|---|
| HC-R1-SLIDE-0-Prior | clear | — | — | |
| HeartDisease | −33 ± 7.74 | |||
| Hospitalization | −50.2 ± 4.76 | |||
| HC-R1-SLIDE-1-ObsHyp | clear | — | — | |
| obs | Hypertension | 75 | ||
| HeartDisease | 4.5 ± 7.59 | |||
| Hospitalization | 2.3 ± 4.28 | |||
| HC-R1-SLIDE-2-ObsHypDiab | clear | — | — | |
| obs | Hypertension | 75 | ||
| obs | Diabetes | 45 | ||
| HeartDisease | 23.2 ± 7.49 | |||
| Hospitalization | 28.6 ± 3.9 | |||
| HC-R1-SLIDE-3-ObsAll | clear | — | — | |
| obs | Hypertension | 75 | ||
| obs | Diabetes | 45 | ||
| obs | Age | 67 | ||
| HeartDisease | 23.2 ± 7.49 | |||
| Hospitalization | 29.8 ± 3.6 |
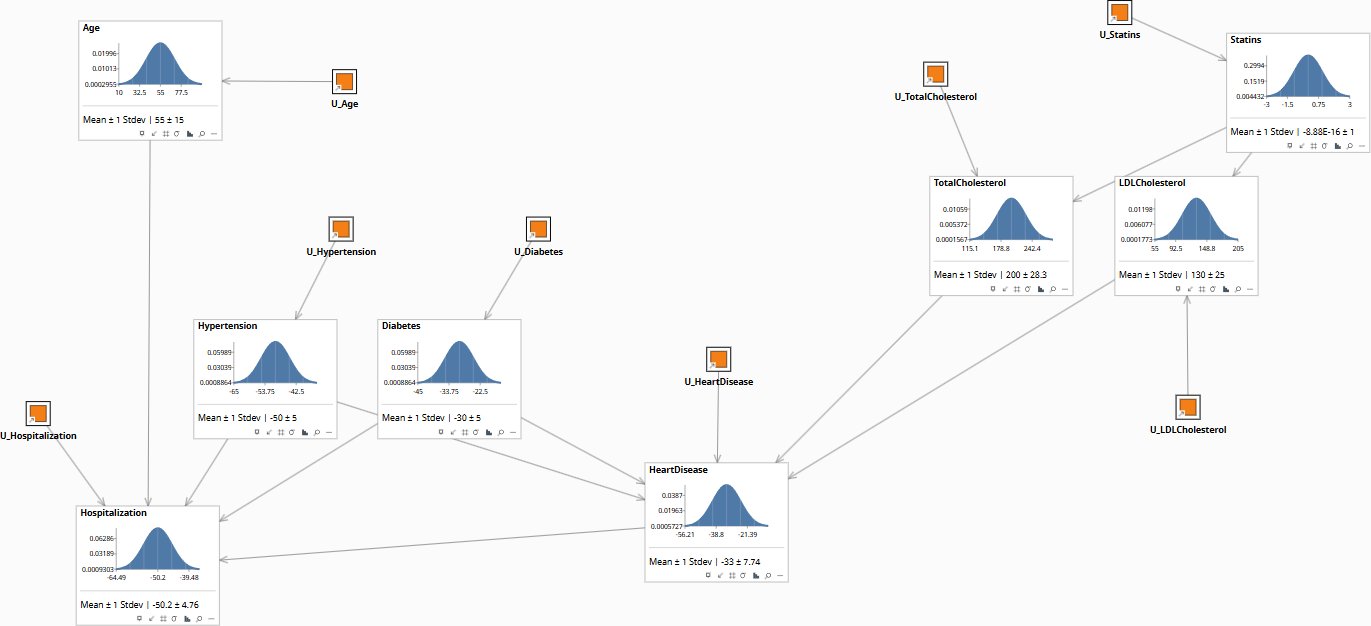
Population prior before any patient data is entered. Heart Disease and Hospitalization sit at their marginal means.
Download the Models
Both models encode the same causal structure — Age, Hypertension, Diabetes, Statin use, Total Cholesterol, LDL Cholesterol, Heart Disease, and Hospitalization — with explicit exogenous U nodes for each endogenous variable. The U nodes are what make Rung 3 counterfactuals possible: abduct them to a specific patient, apply a do() intervention, and read the counterfactual outcome. The Global model is parameterized for a population with a mean age of 55 and baseline cholesterol distributions consistent with a mixed-risk clinical cohort; the Minimal model is identical in structure and is provided as a clean starting point for re-parameterization.
All models require Bayes Server (free edition available). See Download Models for the full library.
If your organization is making statin prescribing, discharge, or readmission decisions using regression-based risk scores, those scores cannot tell you whether the intervention would have changed outcomes for specific patients — and that gap is where liability and budget overruns live.
The models are free. What I provide is the judgment to build the right structure for your specific clinical context, encode your clinicians’ knowledge into it, and turn the output into decisions your board and CMO can act on. The discipline stays with your team.