How this model was built → — an eight-week construction walkthrough. Who was in the room, what the first model got wrong, where the experts disagreed and how the disagreement was reconciled, what survived after the engagement. The page exists for the CDO, head of analytics, or chief actuary who is doing the technical evaluation; this case page exists for everyone else.
Why a Causal Model
Chain-ladder assumes stationarity: future development will follow the same statistical path as past development. When that assumption holds, chain-ladder works well. When it breaks -- because the legal environment has shifted, because injury severity mix has changed, because claims management practices have deteriorated -- the method provides no warning and no diagnosis. It produces numbers from a process that no longer governs the claims.
| Question | Chain-Ladder | Causal Bayesian Network |
|---|---|---|
| Project historical development forward | Well | Well |
| Explain why development is accelerating | Cannot | Via diagnostic query |
| Incorporate legal environment change | Cannot | As explicit node |
| Quantify impact of claims management intervention | Cannot | Via do-calculus |
| Separate social inflation from injury mix shift | Cannot | Via latent variable |
| Produce auditable, node-level explanation | Cannot | Structural by design |
The Questions
- Given the actual development patterns observed on this accident year cohort, what would our ultimate losses have been if the legal environment had remained at its 2018 baseline? — Rung 3 (Counterfactual). Answering it requires abduction to anchor attorney penetration rates, nuclear verdict frequency, and settlement values as fixed background before changing the Legal Environment node; the U nodes on Social Inflation must be updated before the counterfactual is applied.
- If we reduce average claims management response time by 30%, what is the causal effect on IBNR and ultimate loss? — Rung 2 (Intervention). A do() query severs the confounding path from Claims Management Quality through response time, isolating the effect of the operational improvement from the fact that better-managed books tend to have faster response times for structural reasons.
- Adverse prior-year development is accelerating — what is the most probable causal explanation among injury mix shift, legal environment deterioration, and claims management quality decline? — Rung 1 (Association). The graph encodes which dependencies exist between Social Inflation, Injury Mix, and Reserve Adequacy; entering the observed deterioration propagates to every connected upstream node, separating what the data genuinely supports from what the three teams are asserting.
Reading the screenshots: a black check mark on a node means it has been set as observed evidence — a fact entered into the model, and is acting as a filter. A red check mark means it has been set as a do intervention — a decision applied to the model, severing the influence of its parents.
Reading the spec tables: each Run the Analysis block lists the exact steps to reproduce each screenshot in Bayes Server. The Obs / Do column uses three italic control tokens: clear — reset the model to a blank no-evidence state; abduction step — enter the factual observations that anchor the U nodes to this specific case; use abduction result — apply a do() intervention with the U nodes held from the abduction step.
What would our reserves have been if social inflation had not occurred?
“Given the actual development patterns we have observed on this accident year cohort -- attorney penetration rates, nuclear verdict frequency, settlement values -- what would our ultimate losses have been if the legal environment had remained at its 2018 baseline?”
This is Rung 3 -- conditioning on the specific observed development of this cohort and asking what would have happened under a different legal environment. Social inflation is a latent variable: not directly observable, but inferable from its causal effects on observable indicators. Abduction infers its state from what we have actually observed in this cohort. The counterfactual then applies a different legal environment state and computes what the reserve would have been.
The social inflation latent variable model infers the current Social Inflation Environment state from observable proxies -- attorney penetration rate, nuclear verdict frequency, litigation funding activity -- and computes what the Excess Loss Trend would have been under a different latent state. When attorney penetration is elevated, nuclear verdicts are frequent, and litigation funding is active, the model infers Social Inflation = High with high posterior probability. The counterfactual -- what would Excess Loss Trend have been if Social Inflation had remained at its 2018 baseline -- requires abducting the specific background of this cohort's development, then applying the hypothetical latent state. The result is an explicit, auditable estimate of how much of the reserve deterioration is attributable to the legal environment versus manageable operational factors. This is the decomposition the board needs to act on: what is structural (requiring pricing and reinsurance responses) versus what is operational (requiring internal improvement).
| Image | Obs / Do | Node | Set | Result |
|---|---|---|---|---|
| ir-8-prior | — | Social Inflation Environment | 45.0% Low / 35.0% Med / 20.0% High | |
| — | Excess Loss Trend | 18.5% Neg / 40.7% Flat / 40.8% Pos | ||
| ir-9-abduction | obs | Attorney Penetration Rate | Elevated | |
| obs | Nuclear Verdict Frequency | Frequent | ||
| obs | Litigation Funding Activity | Present | ||
| — | Social Inflation Environment | 1.2% Low / 33.2% Med / 65.6% High | ||
| — | Excess Loss Trend | 7.0% Neg / 29.0% Flat / 64.1% Pos | ||
| ir-10-cf-baseline | obs | Attorney Penetration Rate | Elevated | |
| obs | Nuclear Verdict Frequency | Frequent | ||
| obs | Litigation Funding Activity | Present | ||
| do | Social Inflation Environment | Low | ||
| — | Excess Loss Trend | 30.0% Neg / 48.0% Flat / 22.0% Pos |
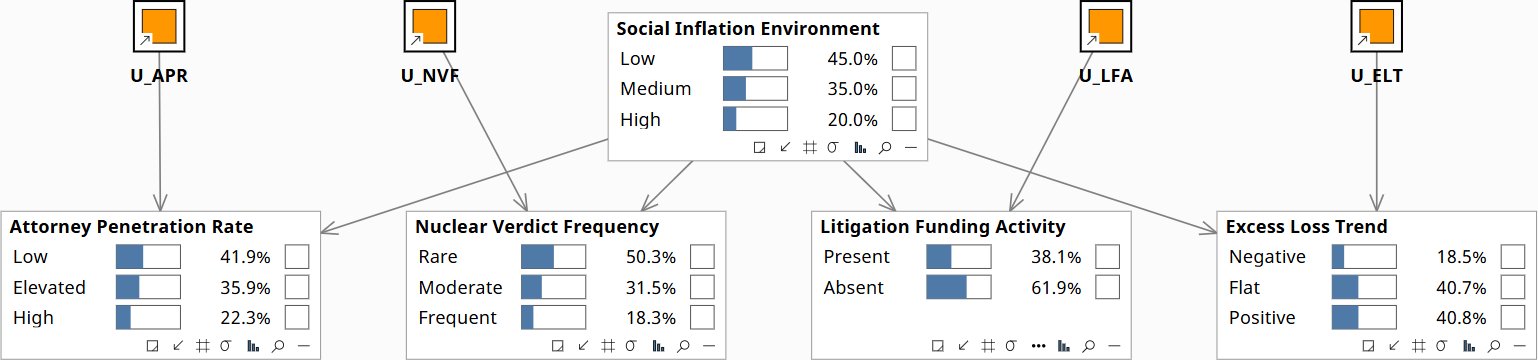
Social Inflation Environment at prior: 45.0% Low / 35.0% Medium / 20.0% High. Excess Loss Trend: 18.5% Negative / 40.7% Flat / 40.8% Positive.
What happens if we improve claims management response time?
“If we invest in early intervention protocols and reduce average claims management response time by 30%, what is the causal effect on IBNR and ultimate loss -- and how does it interact with the current legal environment?”
This is a Rung 2 intervention query -- the do-calculus question chain-ladder cannot ask. Claims management quality is causally upstream of development speed and ultimate cost, but it is also correlated with injury severity: carriers with worse injury mixes invest more heavily in claims management, partially canceling the observed benefit in historical data. The do() operator severs this confound and reveals the true causal effect of the intervention.
do(Claims Management Quality = High) reduces expected Ultimate Loss significantly relative to the prior -- but the magnitude depends on whether Legal Environment = Hostile is also present. In a hostile legal environment, improving claims management quality alone produces less benefit than in a neutral environment, because the legal environment independently drives settlement values through a pathway that claims management cannot intercept (attorney penetration and nuclear verdict risk). This interaction is invisible in the historical triangle because legal environment and claims management quality co-vary: carriers in hostile jurisdictions both invest more in claims management and experience worse development. The causal model separates these effects. The result: claims management investment has the highest ROI in moderate legal environments, not in the most hostile ones -- where reinsurance restructure and geographic re-underwriting are the higher-value responses.
| Image | Obs / Do | Node | Set | Result |
|---|---|---|---|---|
| ir-4-prior | — | Ultimate Loss | 53.2% Adequate / 28.1% Mod Def / 18.7% Sev Def | |
| ir-5-hostile-base | obs | Injury Severity | Severe | |
| obs | Legal Environment | Hostile | ||
| — | Ultimate Loss | 30.8% Adequate / 35.3% Mod Def / 33.8% Sev Def | ||
| ir-6-do-cmq-hostile | obs | Injury Severity | Severe | |
| obs | Legal Environment | Hostile | ||
| do | Claims Management Quality | High | ||
| — | Ultimate Loss | 36.5% Adequate / 35.8% Mod Def / 27.6% Sev Def | ||
| ir-7-do-cmq-benign | obs | Injury Severity | Severe | |
| obs | Legal Environment | Benign | ||
| do | Claims Management Quality | High | ||
| — | Ultimate Loss | 39.0% Adequate / 34.9% Mod Def / 26.1% Sev Def |
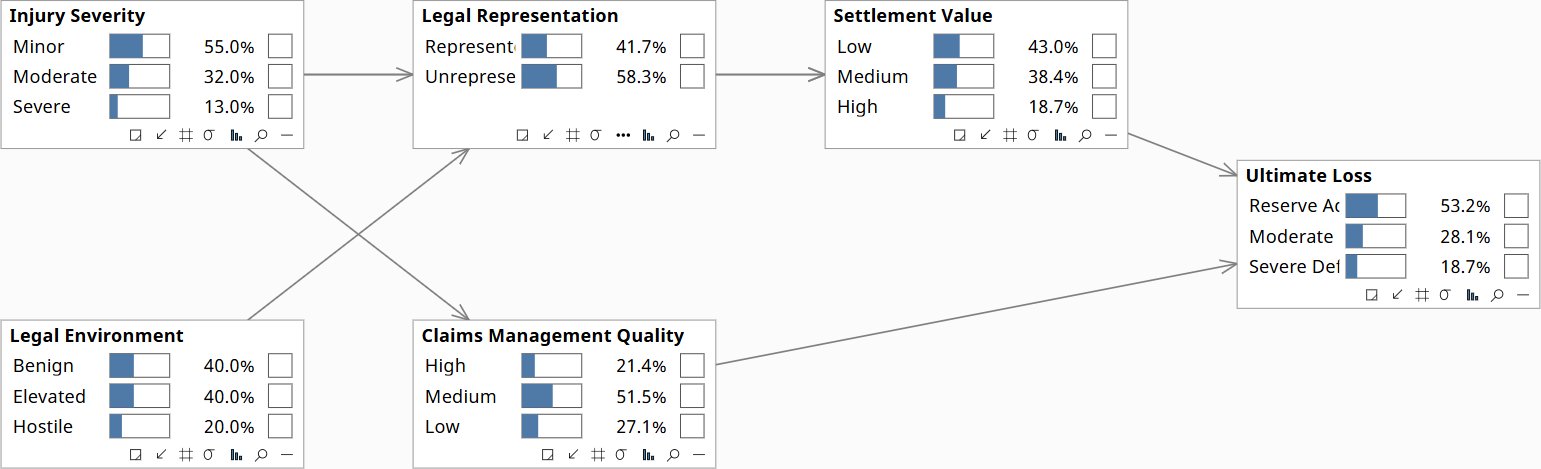
Ultimate Loss at prior: 53.2% Adequate / 28.1% Mod Deficient / 18.7% Severely Deficient.
Why is our reserve deteriorating?
“Adverse prior-year development has been announced. The triangle shows it is accelerating. What is the most probable causal explanation -- injury mix shift, legal environment deterioration, or claims management quality decline?”
This is Rung 1 running in the diagnostic direction: set the observed symptoms as evidence and propagate backward through the causal graph to estimate the posterior probability of each root cause. The same adverse development number produces dramatically different root-cause posteriors depending on jurisdiction context -- and those posteriors determine the management response. Chain-ladder sees the fingerprint. The causal model traces it to its source.
In a benign jurisdiction with stable injury mix, the diagnostic model assigns highest posterior probability to Claims Management Quality as the root cause of adverse development. In a jurisdiction with elevated attorney penetration and litigation funding activity, it assigns highest posterior probability to Legal Environment Change. Same observed symptom. Different causal explanation. Different management response. If the root cause is injury mix shift, the response is re-underwriting. If it is legal environment deterioration, the response is geographic re-underwriting and reinsurance purchasing. If it is claims management quality, the response is internal -- and it is the only root cause primarily within carrier control. The board's question is not "how adverse is the development?" -- they can read that number. The question is why, and therefore what to do.
| Image | Obs / Do | Node | Set | Result |
|---|---|---|---|---|
| ir-1-prior | — | Reserve Adequacy State | 35.5% Adequate / 34.7% Marg Def / 29.8% Sev Def | |
| — | Claims Management Quality | 25.0% High / 50.0% Med / 25.0% Low | ||
| — | Injury Mix Shift | 35.0% Present / 65.0% Absent | ||
| — | Legal Environment Change | 40.0% Deteriorating / 60.0% Stable | ||
| ir-2-adverse-dev | obs | Prior-Year Reserve Development | Adverse | |
| obs | Age-to-Age Development Pattern | Accelerating | ||
| — | Injury Mix Shift | 42.1% Present / 57.9% Absent | ||
| — | Legal Environment Change | 50.7% Deteriorating / 49.3% Stable | ||
| — | Claims Management Quality | 22.4% High / 48.5% Med / 29.1% Low | ||
| — | Reserve Adequacy State | 5.3% Adequate / 48.8% Marg Def / 45.9% Sev Def | ||
| ir-3-jurisdiction | obs | Prior-Year Reserve Development | Adverse | |
| obs | Age-to-Age Development Pattern | Accelerating | ||
| obs | Legal Environment Change | Deteriorating | ||
| — | Injury Mix Shift | 38.6% Present / 61.4% Absent | ||
| — | Claims Management Quality | 23.3% High / 49.5% Med / 27.2% Low | ||
| — | Reserve Adequacy State | 1.9% Adequate / 39.4% Marg Def / 58.6% Sev Def |
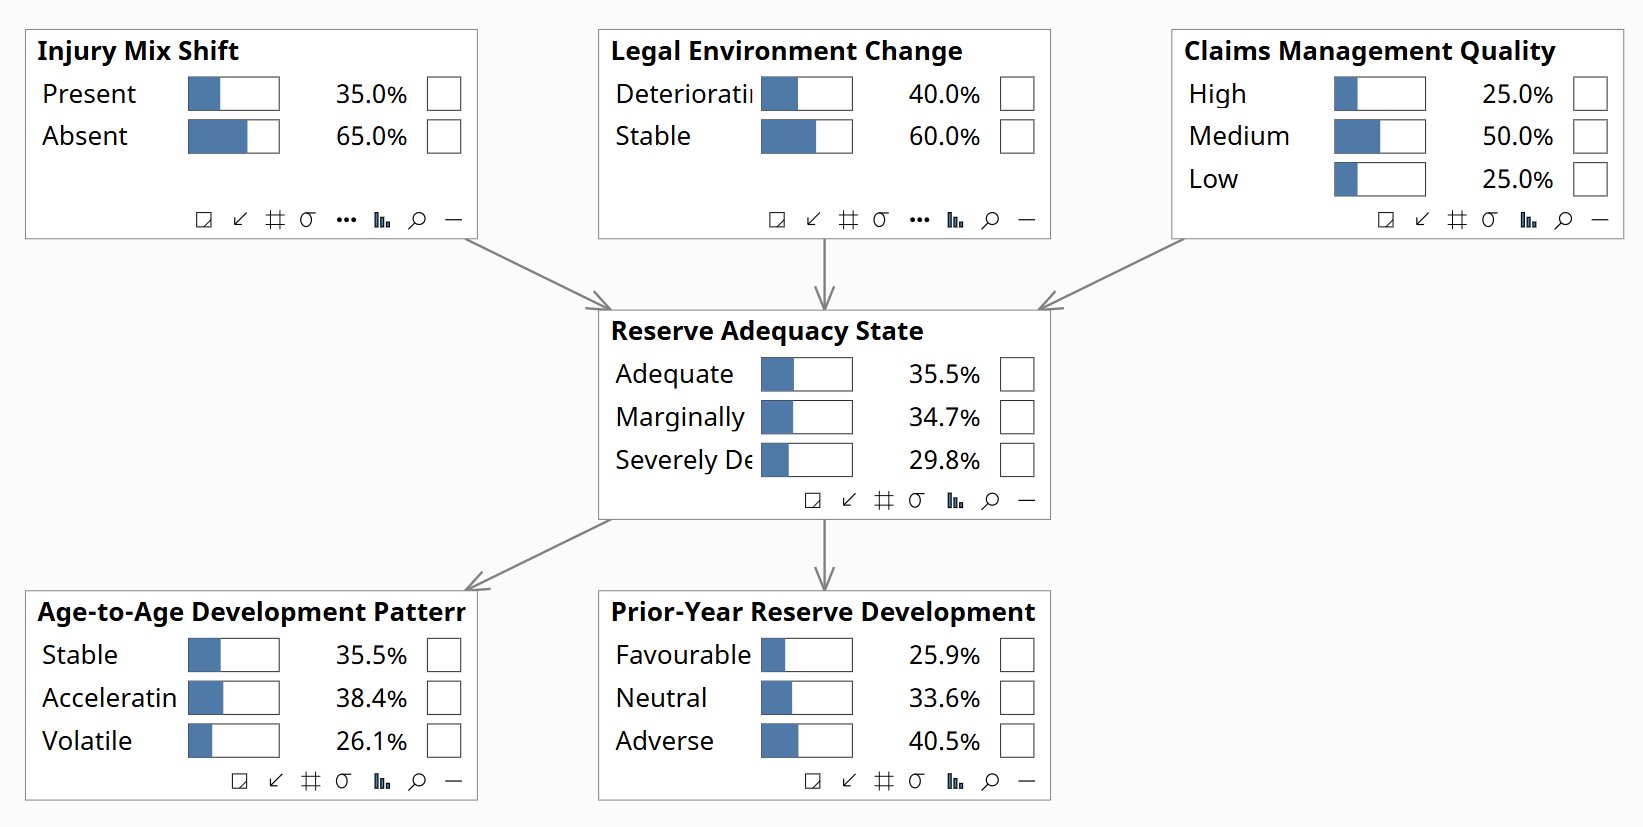
Reserve Adequacy State at prior: 35.5% Adequate / 34.7% Marginally Deficient / 29.8% Severely Deficient. Root causes at base rates.
Download the Models
All models require Bayes Server (free edition available). See Download Models for the full library.
Your reserve actuaries know why the development is changing. That knowledge is not in the triangle. The conversation builds the causal model that makes it explicit, auditable, and usable -- before it walks out the door.
The models are free. What I provide is the judgment to build the right structure for your specific situation, encode your experts’ knowledge into it, and turn the output into decisions your board can act on. The discipline stays with your team.