Why a Causal Model
M&A due diligence has a systematic analytical failure that the deal-making process tends to amplify rather than correct. At Rung 1, the three teams who disagree at the board table — finance on valuation, strategy on fit, risk on customer concentration — are all partially observing the same upstream pressure: competitive deal dynamics and strategic urgency that simultaneously inflate every metric the board is looking at. At Rung 2, earnout structures are offered to targets with revenue uncertainty — which means observed integration outcomes for earnout deals already started from a higher-uncertainty position than cash-at-close deals. At Rung 3, management retention clauses are resisted by strong management teams, meaning the teams most likely to deliver integration are the ones the clause was designed to retain. The intervention query isolates each of these structural confounds from the observational comparison.
| Question | Standard Approach | Causal Approach |
|---|---|---|
| Which board concern is structural? | Review valuation, fit, and concentration independently | Diagnostic model traces all three back to Deal Competitive Pressure and Strategic Urgency confounders |
| Earnout effect on integration | Compare earnout vs cash-at-close deal outcomes | Intervention query severs Revenue Uncertainty confounder; isolates incentive mechanism from deal selection |
| Did the dropped clause cost us? | Compare integration to deal model target | Abduction anchors Management Quality and execution environment; counterfactual restores the clause |
The Questions
- Would insisting on the management retention clause have changed integration performance on a deal that is now 35% below target? — Rung 3 (Counterfactual). Answering it requires abduction to anchor Management Quality and the actual adverse execution environment before restoring the contractual mechanism; the confounder is Management Quality, which must be fixed at its observed value before the intervention is applied.
- What does requiring an earnout actually cause to management retention and integration speed, separate from the fact that earnouts are only offered when revenue is uncertain? — Rung 2 (Intervention). A do() query severs the Revenue Uncertainty and Target Management Motivation confounders, isolating the causal effect of the earnout structure from the conditions that make it more likely to be offered.
- Which of the three competing board concerns — valuation multiple, strategic fit, or customer concentration — is the structural driver versus an artifact of deal competitive dynamics? — Rung 1 (Association). The graph encodes which dependencies exist between Deal Competitive Pressure, Strategic Urgency, and integration outcomes; entering each team’s evidence updates only the genuinely connected nodes.
Reading the screenshots: a black check mark on a node means it has been set as observed evidence — a fact entered into the model, acting as a filter. A red check mark means it has been set as a do intervention — a decision applied to the model, severing the influence of its parents.
Reading the spec tables: each Run the Analysis block lists the exact steps to reproduce each screenshot in Bayes Server. The Obs / Do column uses three italic control tokens: clear — reset the model to a blank no-evidence state; abduction step — enter the factual observations that anchor the U nodes to this specific case; use abduction result — apply a do() intervention with the U nodes held from the abduction step.
Would insisting on the management retention clause have changed integration performance?
“We acquired a target 18 months ago. Integration has underperformed the deal model by 35%. During negotiation we dropped a management retention clause when the seller’s team resisted it. Would keeping it have changed the outcome?”
Management Quality is the confounder: strong managers resist retention clauses because they have leverage, and they also deliver better integration regardless of contractual structure. Observing that the clause was dropped tells you the management team was capable enough to resist — which is a positive signal for underlying integration capability. Abduction first anchors the unobserved background risk to this deal’s actual execution context (the below-target outcome tells us the execution environment was adverse). Then restoring the clause improves Personnel Continuity through the contractual pathway.
The model shows that the retention clause would have improved Personnel Continuity and through it Integration Performance — but not enough to bring the deal to target, because the Management Quality direct path to Integration Performance independently explains a significant portion of the 35% underperformance. The clause was not the deal’s primary failure point. The counterfactual answer: insisting on the clause would have moved the needle, but the board’s fundamental miscalculation was about management quality rather than contract structure.
| Image | Obs / Do | Node | Set | Result |
|---|---|---|---|---|
| ma-cf-0 | — | Management Quality | 30% High / 48% Moderate / 22% Low | |
| — | Retention Clause | 54.3% Included / 45.7% Dropped | ||
| — | Key Personnel Continuity | 37.9% Full / 35.2% Partial / 26.8% Departed | ||
| — | Integration Performance | 22.7% Above / 35.7% On Target / 41.6% Below | ||
| — | Deal Value Realisation | 25.0% Above / 34.5% At / 40.6% Below Model | ||
| ma-cf-1 | obs | Retention Clause | Dropped | Observable from signed agreement |
| obs | Integration Performance | Below Target | U nodes update — deal background anchored | |
| — | Management Quality | 23.7% High / 58.1% Moderate / 18.2% Low (inferred) | ||
| — | Key Personnel Continuity | 8.4% Full / 32.6% Partial / 59.0% Departed | ||
| ma-cf-2 | do | Retention Clause | Included | Severs Management Quality → Clause back-door |
| — | Management Quality | 13.4% High / 51.5% Moderate / 35.2% Low (updated) | ||
| — | Key Personnel Continuity | 41.0% Full / 38.7% Partial / 20.2% Departed (improved) | ||
| — | Integration Performance | 100% Below Target — still clamped from abduction step | ||
| — | Deal Value Realisation | 4.0% Above / 22.0% At / 74.0% Below Model |
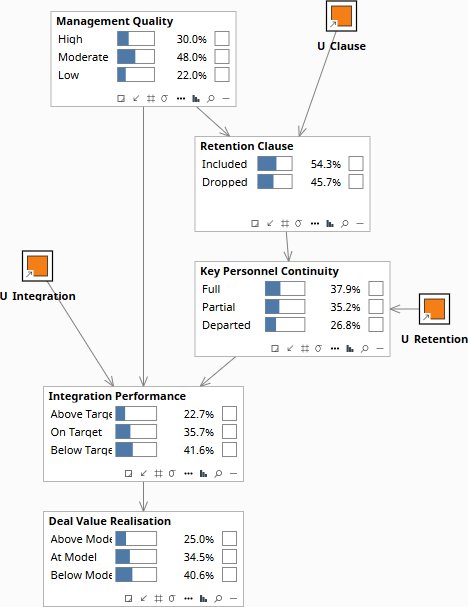
Before any evidence is entered, the model reflects the population prior for M&A integration outcomes across deals of this type and size.
What does an earnout structure actually cause to management retention and integration speed?
“If we require an earnout tied to post-close EBITDA rather than clean cash-at-close, what does that actually cause to management retention and integration speed — separate from the fact that we only offer earnouts to targets where we have revenue uncertainty?”
Revenue Uncertainty Level and Target Management Motivation are the confounders. Earnouts are offered specifically when acquirers have high revenue uncertainty — so observed earnout deals already started from a more uncertain revenue position. Highly motivated management teams resist earnouts because they want certainty, and they also independently deliver better integration. Observing an earnout deal tells you both that revenue was uncertain and that management was not strong enough to resist — both of which negatively predict integration outcomes. The intervention query holds both confounders at their priors, isolating just the incentive mechanism.
The pure causal effect of earnout structures on management retention is negative at high revenue uncertainty — earnout disputes over target definitions become the primary reason senior management exits early. However, the intervention query at moderate uncertainty shows a positive effect on integration speed through incentive alignment. The board is not deciding whether earnouts are good or bad in general — it is deciding whether to impose an earnout on this specific target under its specific uncertainty and management motivation profile. The model separates those conditions.
| Image | Obs / Do | Node | Set | Result |
|---|---|---|---|---|
| ma-int-0 | — | Revenue Uncertainty Level | 30% High / 48% Moderate / 22% Low | |
| — | Target Management Motivation | 35% High / 45% Moderate / 20% Low | ||
| — | Deal Structure | 62.9% Earnout / 37.1% Cash-at-Close | ||
| — | Management Retention | 58.9% Full / 29.1% Partial / 12.0% Departed | ||
| — | Integration Speed | 39.2% Fast / 35.9% On Track / 24.9% Delayed | ||
| ma-int-1 | do | Deal Structure | Earnout | Severs both confounder back-doors |
| — | Revenue Uncertainty Level | 30% High / 48% Moderate / 22% Low — stays at prior | ||
| — | Target Management Motivation | 35% High / 45% Moderate / 20% Low — stays at prior | ||
| — | Management Retention | 53.6% Full / 31.6% Partial / 14.8% Departed — true causal effect | ||
| — | Integration Speed | 37.2% Fast / 36.1% On Track / 26.7% Delayed | ||
| ma-int-2 | obs | Deal Structure | Earnout | Back-door open — confounded estimate |
| — | Revenue Uncertainty Level | 24.0% High / 48.4% Moderate / 27.5% Low — updates (selection) | ||
| — | Target Management Motivation | 30.2% High / 46.0% Moderate / 23.8% Low — infers lower | ||
| — | Management Retention | 55.6% Full / 30.7% Partial / 13.7% Departed | ||
| — | Integration Speed | 37.1% Fast / 36.2% On Track / 26.7% Delayed |
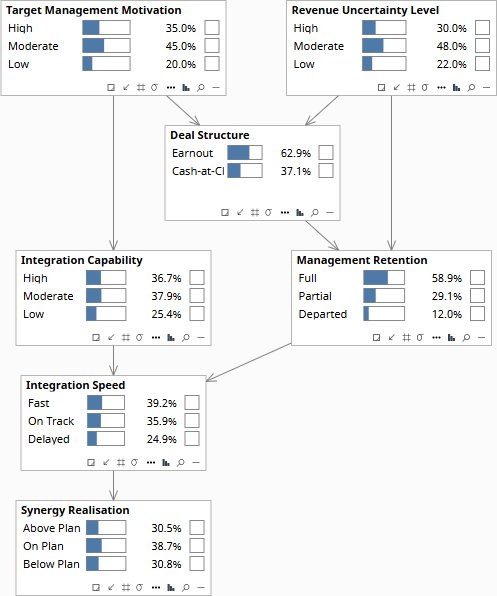
At the prior, the population-average 12-month management retention rate reflects the full mix of deal structures across the acquirer’s historical portfolio.
What does the diligence data actually support as primary value driver and primary risk?
“The board is reviewing a £400M target. Finance says the multiple is too high. Strategy says the strategic fit justifies it. Risk says the customer concentration is the real issue. What does the diligence data actually support?”
Deal Competitive Pressure and Strategic Urgency are the confounders. Contested auctions simultaneously inflate the multiple, compress diligence time, and suppress risk focus — so all three teams’ concerns are partially downstream of the same deal dynamics. Strategic urgency inflates fit perceptions through motivated reasoning and simultaneously reduces appetite to act on concentration risk. At Rung 1, the graph encodes which dependencies exist: confirming a high valuation multiple updates Deal Competitive Pressure, which also shifts customer concentration risk through the same shared confounder.
When only the deal approval decision is entered as evidence, all three concerns update — no single issue dominates. Adding competitive auction evidence shifts valuation multiple and concentration simultaneously through the shared confounder, showing that finance and risk are both partially right about the same underlying problem. The diagnostic result: the board is not choosing between three independent concerns but managing one compound risk from deal dynamics that manifests across all three dimensions at once.
| Image | Obs / Do | Node | Set | Result |
|---|---|---|---|---|
| ma-diag-0 | — | Competitive Auction | 40% Yes / 60% No | |
| — | Strategic Urgency | 25% High / 50% Moderate / 25% Low | ||
| — | Deal Approval | 76.1% Approved / 23.9% Rejected | ||
| ma-diag-1 | obs | Deal Approval | Approved | |
| — | Deal Competitive Pressure | 32.8% High / 40.7% Moderate / 26.5% Low | ||
| — | Strategic Urgency | 23.5% High / 49.4% Moderate / 27.1% Low | ||
| — | Valuation Multiple | 34.5% High / 41.0% Fair / 24.5% Low | ||
| — | Customer Concentration | 30.8% High / 37.0% Moderate / 32.2% Low | ||
| ma-diag-2 | obs | Competitive Auction | Yes | |
| — | Deal Competitive Pressure | 65.0% High — amplifies from 32.8% | ||
| — | Valuation Multiple | 49.6% High — co-moves via DCP | ||
| — | Customer Concentration | 45.9% High — co-moves via DCP | ||
| ma-diag-3 | obs | Strategic Urgency | High | |
| — | Strategic Fit Score | 62% Strong — inflated by urgency | ||
| — | Risk Focus | 10% Adequate / 45% Reduced / 45% Minimal — suppressed |
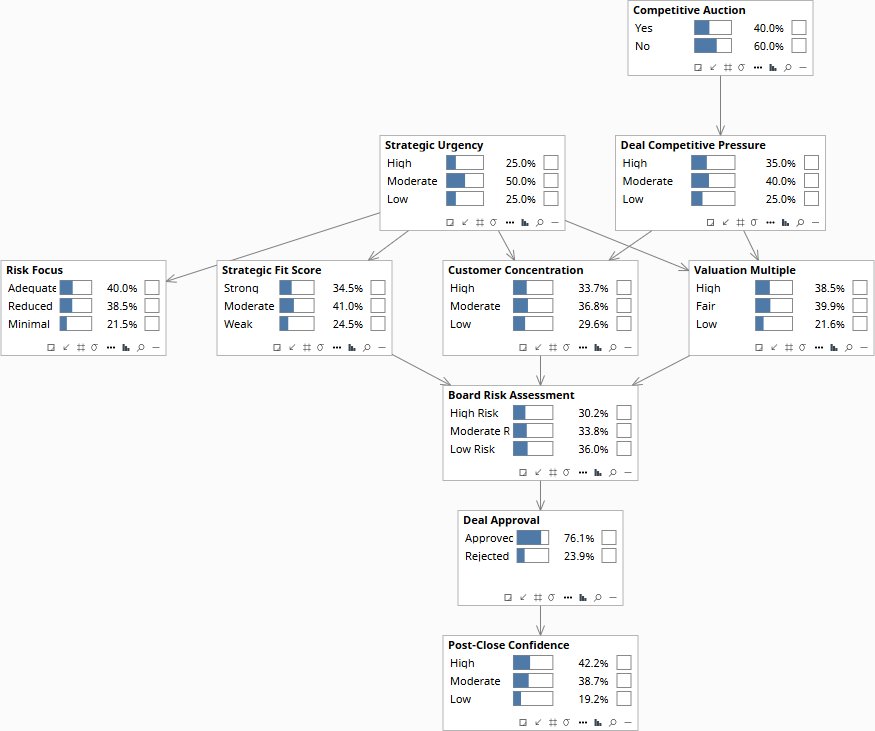
Before any evidence is entered, the three board concerns — valuation, strategic fit, and customer concentration — are independent and weighted roughly by their historical base rates in deals of this sector and size.
Download the Models
All models require Bayes Server (free edition available). See Download Models for the full library.
If your deal committee is weighing three board concerns that all intensified during the competitive process, the diligence data cannot tell you whether those concerns are independent risks or the same upstream problem wearing three different faces.
The models are free. What I provide is the judgment to build the right structure for your specific situation, encode your experts’ knowledge into it, and turn the output into decisions your board can act on. The discipline stays with your team.