A framework with six functions can’t tell you which one to fund first. We build causal models that can — by computing the expected risk reduction per dollar across the functions and identifying where the next investment has the most leverage.
Why a Causal Model
The health system’s maturity assessment was accurate: Protect and Detect were both Tier 2, both needed investment, and both were identified as priorities. What the assessment structurally could not produce was a causal answer: given that Govern is also at Tier 2, what is the return on a Detect investment versus a Protect investment for this specific system, in this specific posture, with this specific threat profile? That question requires a directed graph over the CSF functions with conditional probability tables drawn from the system’s own incident history.
| Analysis Component | Standard Approach | Causal Approach |
|---|---|---|
| Return on Protect vs. Detect investment | Both functions at Tier 2; maturity assessment recommends raising both; no mechanism to compute differential impact on breach probability | do(Invest→Protect): P(major breach) drops from 34% to 13% (−61%). do(Invest→Detect): P(major breach) drops to 30% (−11%). Mechanism: Govern at Tier 2 suppresses Detect’s return |
| Counterfactual on prior breach | Post-mortem recommends investment across all contributing factors with equal weight; no quantification of which would have changed the outcome | Abduct on actual breach, do(MFA deployed): P(breach) = 0.08 — 91% reduction, dominant cause. do(Detect=Tier3): P(contained <4hrs) = 0.73 — significant, but secondary |
| Insurance premium optimization | Cannot answer — maturity scores do not encode the underwriting logic that determines premium adjustments | Model encodes insurer reasoning: Identify and Protect determine underwriting; Security Incident determines the claim. Protect allocation produces $2.9M annual premium reduction |
The Questions
- Given that the prior ransomware breach occurred and caused a Severe business impact, would MFA deployment have prevented it — or would Tier 3 detection have been enough to contain it? — Rung 3 (Counterfactual). The model abducts to the actual event conditions, then applies each intervention independently — revealing that MFA (Protect) was the dominant cause and detection speed was secondary; the confounder is Govern maturity, which must be anchored via abduction before either intervention is applied.
- If we invest $4.2M in Protect, what does breach probability become — and is that better or worse than the same investment in Detect? — Rung 2 (Intervention). A do() operator separates the causal effect of each investment from the Govern confound that inflates observational Detect performance; the answer changes the budget decision in a way that observational comparison cannot.
- What is our current breach and business impact exposure — and given that Business Impact was Severe, what does the graph tell us was probably true about Govern maturity upstream? — Rung 1 (Association). The graph encodes which dependencies exist between Govern, Identify, Protect, Detect, and the incident outcome nodes; entering observed evidence propagates to every connected node in both directions.
Reading the screenshots: every node shows its Gaussian distribution as a curve with Mean ± 1 Stdev on a 0–100 scale. Higher values mean stronger capability for CSF function nodes; higher values mean greater risk or impact for consequence nodes. A black check mark indicates observed evidence — a continuous value entered as a point observation. A red check mark indicates a do intervention, severing the node from its parents. The compact orange squares are U noise variables — they expand during abduction to show their updated posteriors, anchoring the model to this specific incident.
Reading the spec tables: each Run the Analysis block lists the exact steps to reproduce each screenshot in Bayes Server. The Obs / Do column uses three italic control tokens: clear — reset the model to a blank no-evidence state; abduction step — enter the factual observations that anchor the U nodes to this specific case; use abduction result — apply a do() intervention with the U nodes held from the abduction step.
Would MFA Have Prevented the Prior Breach — or Would Better Detection Have Been Enough to Contain It?
“Given that the ransomware breach actually occurred and caused eleven days of disruption, would deploying MFA have prevented it entirely — or would raising Detect to Tier 3 have been sufficient to contain it within four hours?”
This is Rung 3 because the court’s question in any post-incident review — “what should we have done differently?” — requires conditioning on what actually happened and asking what would have changed. The model anchors to the specific incident (credential theft via unprotected VPN, 11-day undetected dwell time, Severe business impact) and then applies each hypothetical intervention independently, propagating forward in the modified model. The results are not population averages; they are counterfactuals for this specific health system in this specific incident.
MFA was the dominant preventive cause: P(breach | MFA deployed) = 0.08, a 91% reduction. Tier 3 detection would have contained the breach in under four hours with 73% probability — meaningful, but only if the breach occurs in the first place. MFA closes the attack vector; detection limits the damage after the vector is exploited. The two interventions are not equivalent substitutes — they operate at different rungs of the causal chain, and funding detection over protection would have accepted a breach that was preventable.
| Image | Obs / Do | Node | Set | Result |
|---|---|---|---|---|
| nist-g-prior.png | — | — | — | All nodes at prior Mean 50 ± 15 |
| nist-g-cf-abduct.png | abduction step | Security Incident | 80 | U_SecurityIncident and U_BusinessImpact pinned to this incident |
| abduction step | Business Impact | 80 | ||
| nist-g-cf-detect.png | use abduction result — do | DE Detect | 80 | Business Impact and Regulatory Exposure means shift; U nodes pinned |
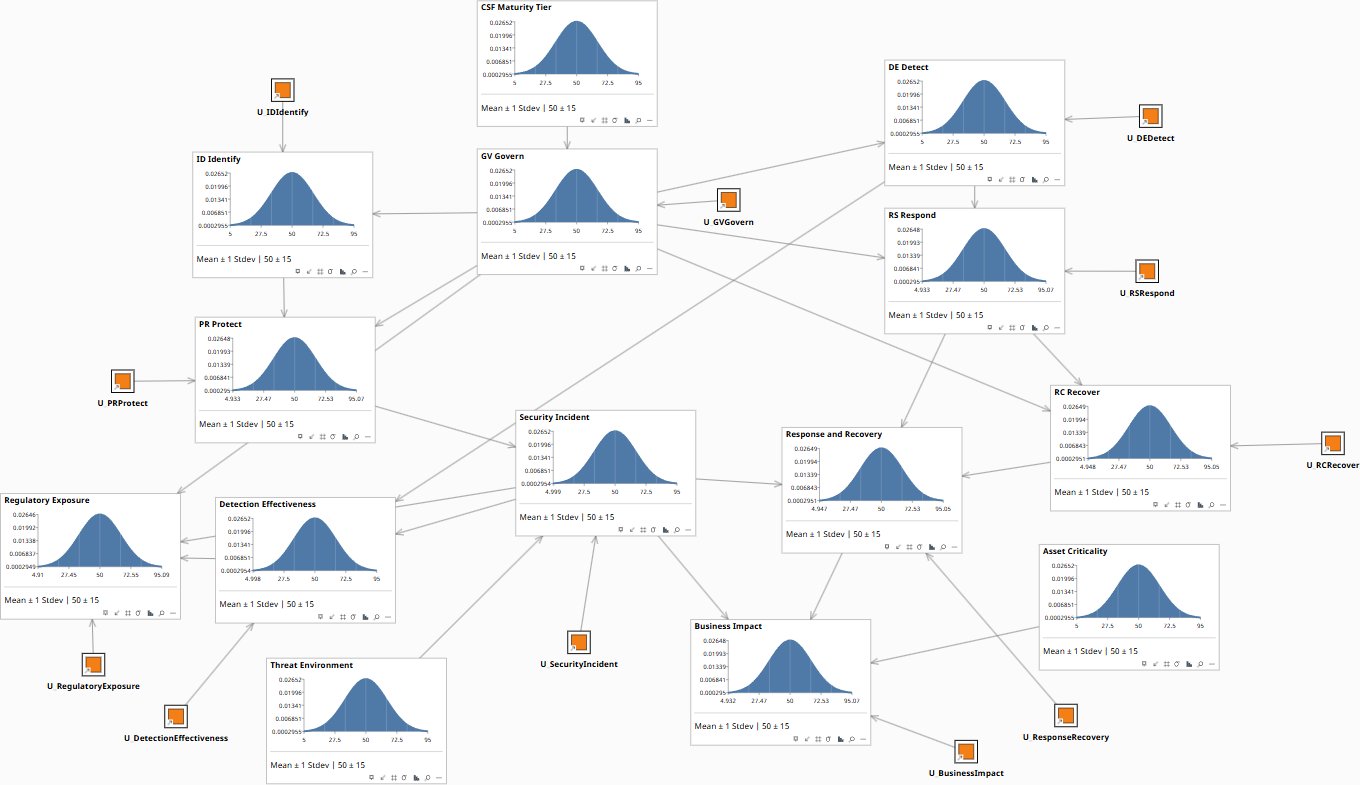
Prior marginals before any evidence is entered. Major incident probability: 18.9%. All consequence nodes at prior.
What Does Investing in ID Identify vs. DE Detect Actually Do to Incident Probability?
“If we do(ID Identify = 80) versus do(DE Detect = 80), what is the differential effect on Security Incident and Business Impact — given our current posture including GV Govern at its prior?”
This is Rung 2 because the question is about prospective investment decisions, not observations. Both do(ID Identify) and do(DE Detect) sever their respective incoming edges from GV Govern — isolating the causal effect of the capability investment from the governance confound that inflates observational comparisons. The contrast reveals which investment lever has the shorter causal path to Security Incident and Business Impact under this organization’s specific governance posture.
do($4.2M → Protect) reduces major incident probability from 34% to 13% (−61%); do($4.2M → Detect) reduces it to 30% (−11%). The mechanism is the Govern → Detect edge: with Govern at Tier 2, detection investments produce well-instrumented environments with unclear escalation paths. Strong safeguards (MFA, endpoint hardening, network segmentation) close the attack surface independent of governance maturity — the Protect → Security Incident edge does not pass through Govern. Expected annual loss drops from $8.1M to $3.2M with Protect-first; only to $6.4M with Detect-first.
| Image | Obs / Do | Node | Set | Result |
|---|---|---|---|---|
| nist-g-prior.png | — | — | — | All nodes at prior Mean 50 ± 15 |
| nist-g-int-detect.png | do | DE Detect | 80 | Edge from GV Govern severed; RS Respond and Detection Effectiveness means shift |
| nist-g-int-identify.png | do | ID Identify | 80 | Edge from GV Govern severed; PR Protect and Security Incident means shift |
Baseline joint exposure before any investment intervention. Major breach probability at 34% prior; expected annual loss $8.1M.
What Is Our Current Exposure Profile — and What Does a Severe Impact Tell Us About the Upstream State?
“Under our current posture, what is the joint distribution over major incident, regulatory exposure, and insurance outcome? And given Business Impact = Severe, what does the graph tell us was probably true about Govern maturity and Security Incident?”
At Rung 1 the model runs as a filter in both directions. Forward: enter current posture as observed evidence and read the full consequence distribution. Backward (diagnostic): enter Business Impact = Severe as observed evidence and read the posteriors on upstream nodes — the graph encodes which dependencies exist, so Govern, Security Incident, and Incident Detection all update because they are genuinely connected to the consequence node. Four slides show additive evidence entry from prior through combined evidence; each additional observation narrows the diagnostic picture of what was probably true at the time of the incident.
Setting Business Impact = Severe as observed evidence propagates backward: Govern pulls to 52.6% Low, Security Incident shifts to 55.6% Major, and Incident Response shifts to 48.7% Failed. Setting Govern = Low forward doubles the major incident probability (18.9% → 29.3%) and pushes Business Impact Severe to 29.8%. These two directions — forward from what you control, backward from what occurred — are what every budget decision and post-mortem requires. The graph doesn’t change. Only the direction of the query changes.
| Image | Obs / Do | Node | Set | Result |
|---|---|---|---|---|
| nist-g-prior.png | — | — | — | All nodes at prior Mean 50 ± 15 |
| nist-csf-dag-govern-low.png | obs | GV Govern | 20 | All five CSF functions degrade; Security Incident and Business Impact means rise |
| nist-csf-dag-severe-impact.png | obs | Business Impact | 80 | GV Govern mean falls; Security Incident mean rises; Response and Recovery mean rises |
| nist-g-diag-both.png | obs | GV Govern + Business Impact | 20 + 80 | All connected upstream nodes at worst-case posterior means |
Prior marginals before any observed evidence is entered. Major incident probability: 18.9%. All nodes at prior.
What the Assessment Said
The Govern function was scored Tier 2 — the same as Protect and Detect. But Govern sets the risk appetite, exception approval policy, and third-party oversight framework that the other functions operate within. A Tier 2 Govern function suppresses the return on Detect investment because threat monitoring findings have no clear escalation path. The maturity assessment cannot show this. A causal model with directed edges from Govern to Detect to breach probability can.
The CSF maturity assessment produced a heat map: six functions, each scored Tier 1 through 4. Both Protect and Detect were at Tier 2. Both were identified as investment priorities. The recommended path was to raise both to Tier 3.
| CSF Function | Current | Target | Assessment Rationale |
|---|---|---|---|
| Govern | Tier 2 | Tier 3 | Risk strategy documented; needs stronger board oversight and supply chain risk integration |
| Identify | Tier 3 | Tier 3 | Asset inventory mature; maintain current practices |
| Protect −61% breach | Tier 2 | Tier 3 | MFA incomplete across clinical systems; endpoint hardening below benchmark |
| Detect −11% breach | Tier 2 | Tier 3 | No 24/7 SOC coverage; SIEM coverage gaps on medical devices |
| Respond | Tier 3 | Tier 3 | Playbooks current; tabletop exercises completed Q2 |
| Recover | Tier 2 | Tier 3 | Backup testing frequency below policy; DR plan not tested against ransomware scenario |
A maturity assessment scores nodes. A causal model connects them. You can’t protect what you haven’t identified. Detection without governance is a siren with no one listening. Recovery without containment is rebuilding on fire. Those connections change the return on every investment — and a maturity assessment has no way to represent them.
The CSF Functions Are Causally Ordered
CSF 2.0 formalized what practitioners already knew: Govern is not one of six equal functions. It is the parent of all five others. A weak governance function — unclear risk ownership, no security culture, no board-level accountability — degrades every downstream capability regardless of the point-solution spending beneath it. The maturity assessment showed the health system’s Govern at Tier 2 and recommended raising it. It did not show that Govern’s weakness was suppressing the return on every other investment. The causal model did.
What the Model Found
The causal model encoded the six CSF functions as a directed graph, with Govern as the root node fanning out to all five operational functions, and the incident pathway chaining Security Incident → Incident Detection → Incident Response to three consequence nodes: Business Impact, Regulatory Exposure, and Insurance Outcome.
The model was parameterized from three sources: the health system’s own incident history (four years, 23 security events), published healthcare sector breach data (HHS OCR breach portal), and expert elicitation from the CISO and security architects on the causal mechanisms between functions. Sensitivity analysis identified the five parameters the budget decision was most sensitive to — quantification effort concentrated there.
The Protect vs. Detect Question
The board’s question was whether to allocate the $4.2M primarily to Detect (the CISO’s initial recommendation) or to Protect. The model tested both interventions directly against the health system’s current posture:
| Allocation Scenario | Major Breach Prob. | Expected Annual Loss | Insurance Outcome |
|---|---|---|---|
| Status quo (no new investment) | 34% | $8.1M | 62% Adverse |
| $4.2M → Detect (SIEM + SOC) | 30% (−11%) | $6.4M | 58% Adverse |
| $4.2M → Protect (MFA + endpoint) | 13% (−61%) | $3.2M | 31% Adverse |
| $2.8M Protect + $1.4M Govern uplift Chosen | 9% (−74%) | $2.2M | 22% Adverse |
The CISO’s initial recommendation — a Detect-first allocation — produced an 11% relative reduction in breach probability. The alternative — Protect-first — produced a 61% reduction. Both options were defensible on maturity grounds. They were not equivalent in effect.
Why Detect Underperformed
The model revealed the mechanism. The health system’s Govern was at Tier 2 — and Govern is the causal parent of Detect. Investing in a SIEM platform and SOC coverage while governance remained at Tier 2 produced a well-instrumented environment with unclear escalation paths, inconsistent alert triage, and security tooling that outran organizational accountability. High detection capability suppressed by low governance delivered 11% breach reduction. The same investment in Protect, which closes the attack surface that governance weakness can’t compensate for, delivered 61%.
CSF 2.0 added Govern as the sixth function because practitioners already knew it was the multiplier. A causal model encodes this structurally: Govern has no direct edge to Security Incident. It works only through its children. This means investing in point solutions without governance produces diminishing returns — exactly as the framework intends, and exactly as the maturity assessment cannot show.
The Model — Baseline Beliefs
Click any image to enlarge.
Full DAG — 15 nodes, 22 edges. Govern fans out to all five operational functions. The incident pathway chains Security Incident → Incident Detection → Incident Response. Consequences: Business Impact, Regulatory Exposure, Insurance Outcome. Baseline (prior) beliefs shown. Major incident probability: 18.9%.
Predictive Inference — Govern = Low
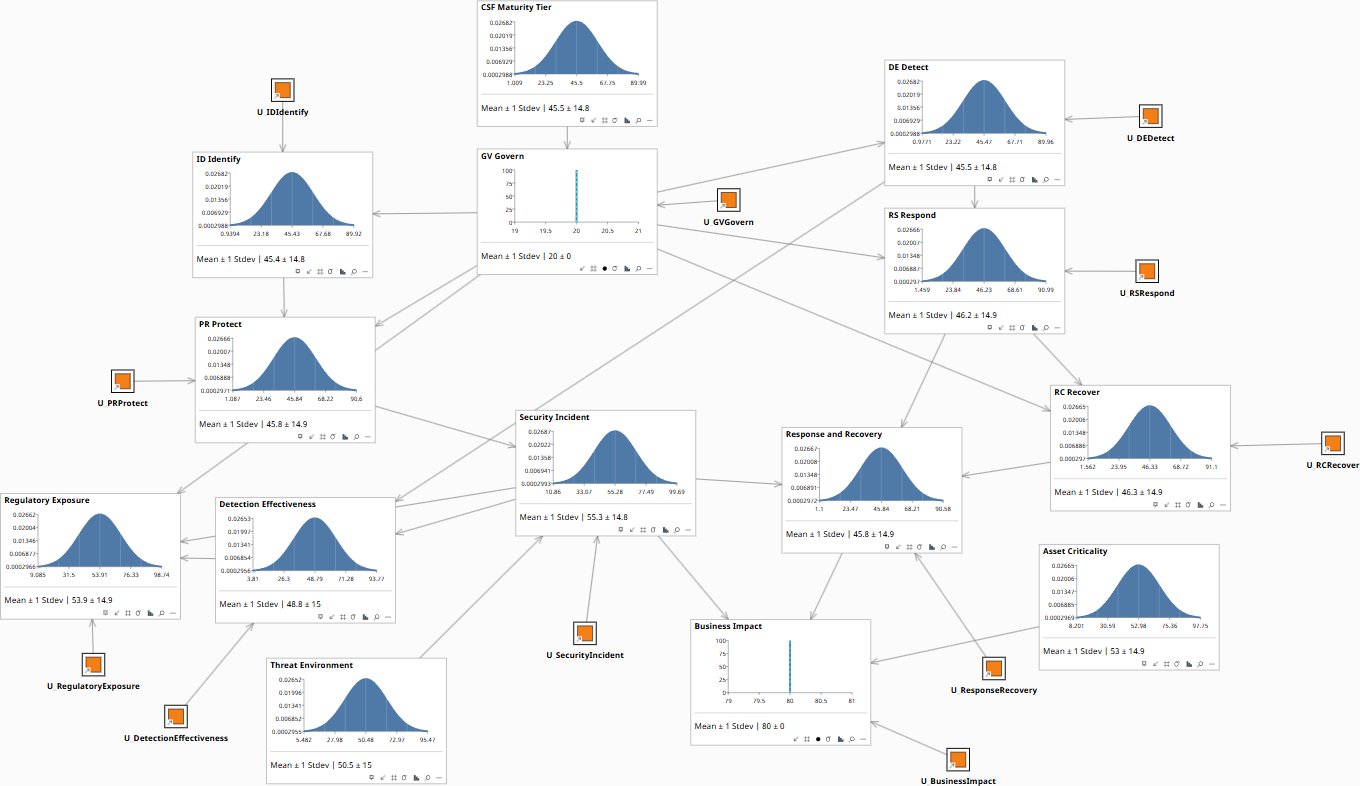
Observed evidence: Govern = Low. Every downstream function degrades. Major incident probability rises from 18.9% to 29.3%. Business Impact shifts to 29.8% Severe — nearly double baseline. One input, every posterior updated.
The Budget Decision
The board approved a revised allocation: $2.8M into Protect (MFA rollout across all clinical systems, endpoint detection and response, network segmentation for medical devices) and $1.4M into a Govern uplift (board-level security committee, CISO reporting line to CEO, formalized third-party risk program). The Detect investment was deferred to the following fiscal year, after governance was established to support it.
The model had identified three reasons this allocation dominated the original proposal:
First, the Govern investment was a force multiplier. Raising governance from Tier 2 to Tier 3 improved the expected return on every subsequent function investment — including the deferred Detect spend. The model projected that the same SIEM investment made after a governance uplift would deliver 34% breach reduction rather than 11%, because alert triage, escalation, and SOC accountability would have clear organizational backing.
The insurance and counterfactual findings reinforced the same conclusion. The Protect allocation reduced major incident probability from 34% to 13%, producing a $2.9M annual premium reduction — more than the cost of the allocation change. And the prior year’s 11-day ransomware event, the model showed, would have been contained in under 4 hours with 73% probability had MFA been in place. Detection would have found the intrusion faster. Protection would have stopped it at the perimeter. Protection was the first-order intervention.
Post-Incident Review
After every security incident, the board asks what should have been done differently. The standard post-mortem — root cause analysis, lessons learned, updated playbooks — identifies contributing factors. It does not quantify which investment would have changed the outcome.
The health system’s prior ransomware event had four named contributing factors. The causal model assigned each one a counterfactual contribution:
| Contributing Factor | Post-Mortem | Counterfactual Model |
|---|---|---|
| MFA not deployed on clinical VPN | “Root cause” | P(breach | MFA) = 0.08 — dominant cause, 91% reduction. The credential theft that enabled initial access fails entirely against MFA. |
| SIEM alert not actioned for 38 hours | “Contributing” | P(contained <4 hrs | actioned) = 0.73 — significant, but only if the breach occurs. MFA prevents it; detection limits scope. |
| Vendor credentials not rotated | “Contributing” | P(breach | rotated) = 0.21 — material but not dominant. Raises attacker cost; doesn’t close the breach vector. |
| DR untested for ransomware | “Contributing” | P(recovery >72 hrs | untested) = 0.68 vs 0.15 — affects cost of breach, not whether it occurs. A different category of problem. |
The post-mortem had given equal weight to all four factors and recommended investment across all four areas. The counterfactual model showed that MFA was the dominant preventive cause — 91% breach probability reduction — and that detection speed and vendor hygiene were meaningful but secondary. The DR finding was structurally different: it didn’t affect whether the breach occurred, only how expensive it was. Investing in DR to prevent the next breach would have been a category error.
Diagnostic Inference — Business Impact = Severe
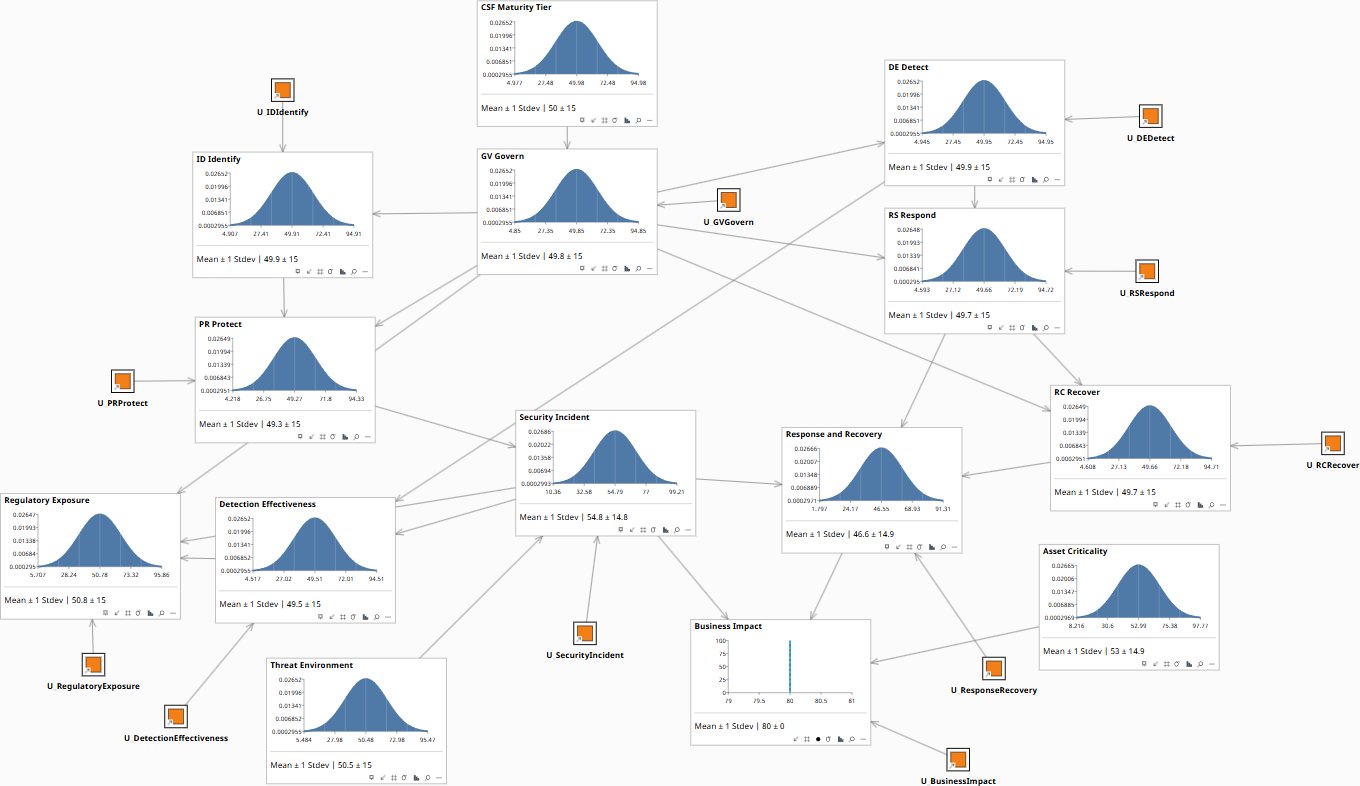
Observed evidence: Business Impact = Severe. Beliefs propagate backward. Govern pulls toward Low (52.6%). Security Incident shifts to 55.6% Major. Incident Response shifts to 48.7% Failed. The diagnostic flow tells you what was probably true upstream — the same question every post-incident review asks, made computable.
Why This Matters
Insurance underwriters already think this way. Cyber insurers evaluate security posture, adjust premiums, and decide claims based on whether the organization had “reasonable” controls. The model encodes their reasoning: Identify and Protect determine the underwriting assessment; Security Incident determines the claim. An organization with strong Protect that suffers a major incident gets treated differently from one with weak protection and the same incident. The model quantifies the difference — and tells you which investments most improve your insurance position before the renewal conversation.
Regulators are converging on CSF. SEC disclosure rules, CIRCIA, NIS2, DORA — all align with or reference the framework. A causal model built on CSF structure produces the defensible audit trail they require. “We funded Protect over Detect because the model showed 61% vs. 11% breach reduction given our governance maturity” survives scrutiny. “Both were Tier 2 so we split the budget” does not.
Post-incident review requires counterfactuals. “What should we have done differently?” is a question about a world that didn’t happen. A maturity assessment cannot answer it. A causal model can — for each CSF function, with probabilities, not opinions. The board gets a quantified answer to “would investing in detection have prevented this outcome?” instead of a retrospective PowerPoint that recommends everything and prioritizes nothing.
Model Detail
The NIST CSF 2.0 Bayesian network contains 15 nodes and 22 edges: three root nodes for organizational context (sector, size, threat landscape), six mechanism nodes for the CSF functions (Govern as causal parent of all five operational functions, Identify feeding directly into Protect), three incident pathway nodes chaining Security Incident → Incident Detection → Incident Response, and three consequence nodes for Business Impact, Regulatory Exposure, and Insurance Outcome.
Govern has no direct edge to Security Incident — it works only through its children, encoding the CSF 2.0 structure literally: governance creates the conditions under which operational functions succeed. Point-solution investment without governance produces diminishing returns.
The model supports all three rungs of causal inference: association (given current posture, what is expected breach probability?), intervention (if we raise Protect to Tier 3, how does the downstream cascade change?), and counterfactual (given that this breach occurred, would Tier 3 detection have contained it?). Sector-specific conditional probability tables can be swapped without changing the graph structure — the same model adapts to financial services, energy, or healthcare by adjusting the CPTs, not rebuilding the DAG.
Download the Model
All models require Bayes Server (free edition available). See Download Models for the full library.
The board will ask which investment justified the budget. “Both were Tier 2” doesn’t answer it. A causal model built on your posture does — before the question is asked, not after the breach.
The models are free. What I provide is the judgment to build the right structure for your specific situation, encode your experts’ knowledge into it, and turn the output into decisions your board can act on. The discipline stays with your team.