Why a Causal Model
The risk register contained eight risks across six categories. Total score: 82. On paper, a managed portfolio. In reality, eight rows that shared causes, interacted through mechanisms, and would fire simultaneously in a tail event. Storm surge and building age are not independent rows -- coastal cities developed earlier, so the oldest building stock is concentrated in the highest-hazard zones. In a tail event, both mechanisms fire simultaneously: severe surge hitting degraded structures. The register had no way to represent this. Its architecture had no arrows.
The board's instinct was to raise rates. The causal model showed this was precisely the wrong first lever. Building Vintage is a confounder for the rate-adverse selection mechanism: legacy buildings cannot easily find alternative coverage, so a rate increase retains the worst risks (who have nowhere to go) and drives away the better ones (who do). The causal model encodes this feedback loop as an explicit mechanism. The register lists "adverse selection" as a separate risk row -- it cannot show that a proposed intervention causes it.
| Question | Risk Register | Causal Model |
|---|---|---|
| True 1-in-100yr tail exposure | $66M (independent rows) | $97M (correlated tail from Building Vintage x Storm Surge) |
| Effect of 15% rate increase | Cannot answer | do(Rate Action = Increase): Portfolio Composition worsens, Loss Ratio deteriorates despite higher premium |
| Building Vintage as confounder | Not modeled | Legacy buildings drive both adverse selection AND higher vulnerability -- do() severs this back-door |
| What would loss ratio have been under Hold? | Cannot answer | Rung 3: abduct U nodes from factual evidence, then do(Rate Action = Hold) |
| Which lever combination is optimal? | Cannot answer | Compare Loss Ratio posteriors across intervention scenarios |
The Questions
- Given the actual storm season and building vintage mix, what would our loss ratio have been if we had held rates at the prior year level? — Rung 3 (Counterfactual). Answering it requires abduction to anchor the portfolio’s actual Building Vintage composition and Storm Season severity before changing the rate decision; Organizational Risk Appetite is the confounder that must be fixed so it does not absorb the intervention’s effect.
- If we apply a 15% rate increase across the coastal book, what is the true causal effect on Portfolio Composition and Loss Ratio? — Rung 2 (Intervention). A do() query severs the confounding path from Building Vintage through the rate-setting decision, isolating the effect of the increase from the fact that rate increases are applied more aggressively to already-deteriorated portfolios.
- Our loss ratio came in Adverse — what does the model infer about the upstream states that most likely produced that outcome? — Rung 1 (Association). The graph encodes which dependencies exist between Storm Season, Building Vintage, Portfolio Composition, and Loss Ratio; entering the adverse outcome propagates probability to every connected upstream node.
Reading the screenshots: a black check mark on a node means it has been set as observed evidence — a fact entered into the model, acting as a filter. A red check mark means it has been set as a do intervention — a decision applied to the model, severing the influence of its parents.
Reading the spec tables: each Run the Analysis block lists the exact steps to reproduce each screenshot in Bayes Server. The Obs / Do column uses three italic control tokens: clear — reset the model to a blank no-evidence state; abduction step — enter the factual observations that anchor the U nodes to this specific case; use abduction result — apply a do() intervention with the U nodes held from the abduction step.
What would our loss ratio have been if we had held rates?
“Given the actual storm season, the actual building vintage mix in our book, and the actual adverse loss ratio we experienced -- what would the loss ratio have been if we had held rates at the prior year level rather than implementing the 15% increase?”
This is Rung 3 -- conditioning on everything that was actually true about this specific book year and asking what would have happened under a different rate decision. The three steps: abduction (fix the background by updating all U nodes from the observed evidence), action (apply do(Rate Action = Hold)), prediction (compute the Loss Ratio counterfactual with the same U node posteriors). Without U nodes this silently collapses to a Rung 2 average -- not an answer about this specific book year.
Under Hold, Portfolio Composition improves from 60.2% to 45.0% Adverse and Loss Ratio falls from 100% Adverse to 39.8% Adverse. The rate increase accounts for a material share of the deterioration -- but the storm season and legacy vintage ensure the book year remains difficult regardless. This is the distribution the board needs to evaluate prudency: not a point estimate, but a probability distribution over Loss Ratio outcomes given the specific adverse background of this year, under the hypothetical of a different rate decision.
| Image | Obs / Do | Node | Set | Result |
|---|---|---|---|---|
| pi3-5-abduction | obs | Storm Season | Severe | |
| obs | Building Vintage | Legacy | ||
| obs | Loss Ratio | Adverse | ||
| — | Storm Surge | 13.3% Low / 36.3% Mod / 50.4% Cat | ||
| — | Portfolio Composition | 10.4% Imp / 29.4% Stable / 60.2% Adv | ||
| pi3-6-do-hold | do | Rate Action | Hold | |
| — | Portfolio Composition | 16.5% Imp / 38.5% Stable / 45.0% Adv | ||
| — | Portfolio Loss | 27.9% Low / 27.9% Mod / 44.3% Cat | ||
| — | Loss Ratio | 28.9% Fav / 31.3% On-Target / 39.8% Adv |
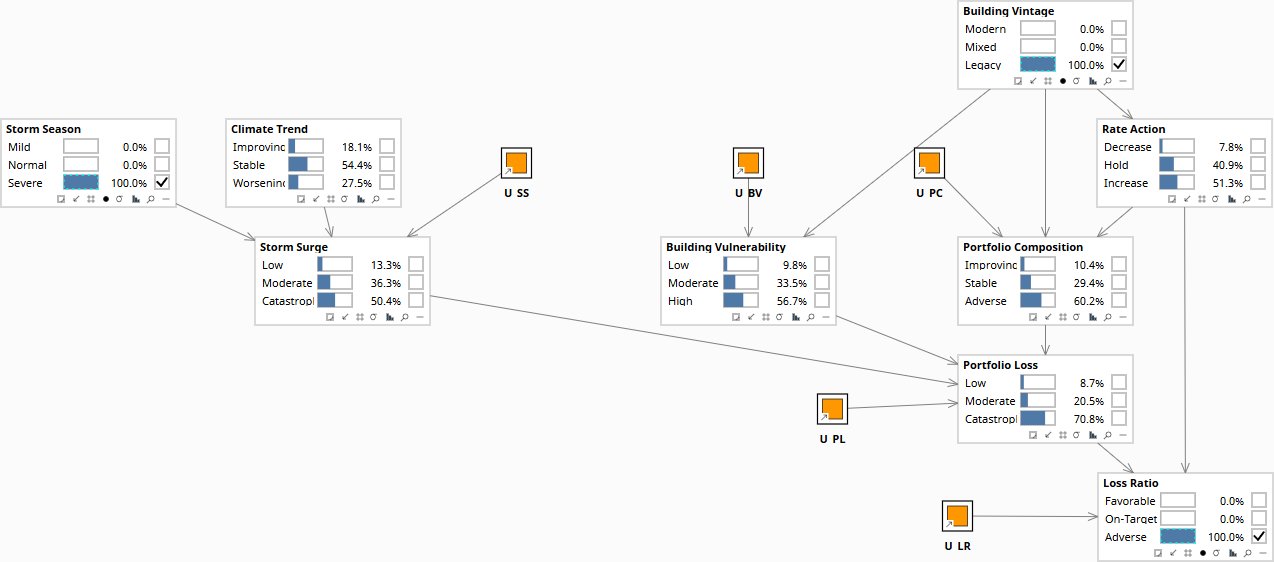
Storm Season = Severe, Building Vintage = Legacy, Loss Ratio = Adverse entered as evidence. U nodes shift from flat 50/50 — anchoring the specific background of this adverse book year. Portfolio Composition: 60.2% Adverse.
What does raising rates actually do to the portfolio?
“If we apply a 15% rate increase across the coastal book, what is the true causal effect on Portfolio Composition and Loss Ratio -- separated from the building vintage that makes rate increases look more effective in the historical data than they actually are?”
Building Vintage is a confounder for Rate Action: legacy buildings both attract rate increases and have worse vulnerability. Observing Rate Action = Increase updates Building Vintage toward Legacy, carrying adverse vulnerability into the posterior. Intervening with do(Rate Action = Increase) severs this back-door -- Building Vintage stays at its prior -- and isolates the pure causal effect on Portfolio Composition and Loss Ratio.
Under do(Rate Action = Increase), Building Vintage stays at its prior (30/45/25) but Portfolio Composition shifts to 57.2% Adverse and Loss Ratio deteriorates to 41.0% Adverse despite higher premium -- adverse selection dominates. Under obs(Rate Action = Increase), Building Vintage inflates to 41.7% Legacy, making the effect appear worse than it is. The gap between do() and obs() is the confounding bias that any observational analysis of rate effectiveness carries. The do() result is what the board needs before committing to the increase.
| Image | Obs / Do | Node | Set | Result |
|---|---|---|---|---|
| pi3-3-rate-do | do | Rate Action | Increase | |
| — | Building Vintage | 30.0% Modern / 45.0% Mixed / 25.0% Legacy | ||
| — | Portfolio Composition | 11.8% Imp / 31.0% Stable / 57.2% Adv | ||
| — | Loss Ratio | 26.7% Fav / 32.3% On-Target / 41.0% Adv | ||
| pi3-4-rate-obs | obs | Rate Action | Increase | |
| — | Building Vintage | 16.7% Modern / 41.7% Mixed / 41.7% Legacy | ||
| — | Portfolio Composition | 9.6% Imp / 28.7% Stable / 61.7% Adv | ||
| — | Loss Ratio | 25.9% Fav / 32.0% On-Target / 42.1% Adv |
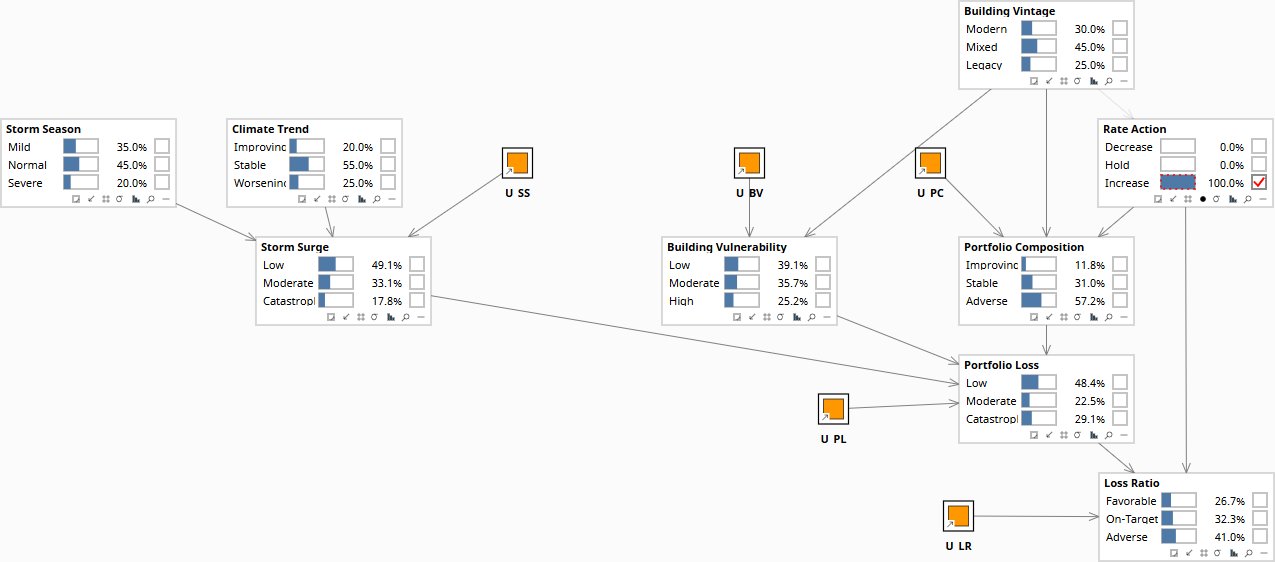
Building Vintage stays at prior (30/45/25). Portfolio Composition: 57.2% Adverse. Loss Ratio: 41.0% Adverse despite higher premium. Adverse selection dominates the rate benefit.
Why did the loss ratio deteriorate?
“Our loss ratio came in Adverse. What does the causal model infer about the upstream states -- the storm season, the building vintage mix, and the portfolio composition -- that most likely produced that outcome?”
This is Rung 1 running in the diagnostic direction. Set the observed outcome and propagate backward through the causal graph. The result is a posterior over upstream states constrained by the graph structure -- the model knows that Storm Surge determines severity through Building Vulnerability, and that Portfolio Composition is jointly caused by Rate Action and Building Vintage. A flat regression cannot make these distinctions. The graph does the work.
Observing Loss Ratio = Adverse shifts Storm Surge toward Catastrophic (28.9%), Building Vulnerability toward High (31.2%), Portfolio Composition toward Adverse (42.5%), and Portfolio Loss to 58.4% Catastrophic. The diagnostic posteriors tell the board which upstream conditions are most causally consistent with the observed outcome. This is the limit of Rung 1: it tells you what to investigate. Whether Storm Surge caused it (weather, unmanageable) or Portfolio Composition caused it (underwriting failure, manageable) requires Rung 2 to distinguish.
| Image | Obs / Do | Node | Set | Result |
|---|---|---|---|---|
| pi3-1-prior | — | Loss Ratio | 35.4% Fav / 31.4% On-Target / 33.2% Adv | |
| — | Portfolio Loss | 49.9% Low / 22.5% Mod / 27.6% Cat | ||
| pi3-2-lr-adverse | obs | Loss Ratio | Adverse | |
| — | Storm Surge | 37.1% Low / 34.0% Mod / 28.9% Cat | ||
| — | Building Vulnerability | 32.5% Low / 36.2% Mod / 31.2% High | ||
| — | Portfolio Composition | 22.1% Imp / 35.4% Stable / 42.5% Adv | ||
| — | Portfolio Loss | 20.0% Low / 21.5% Mod / 58.4% Cat |
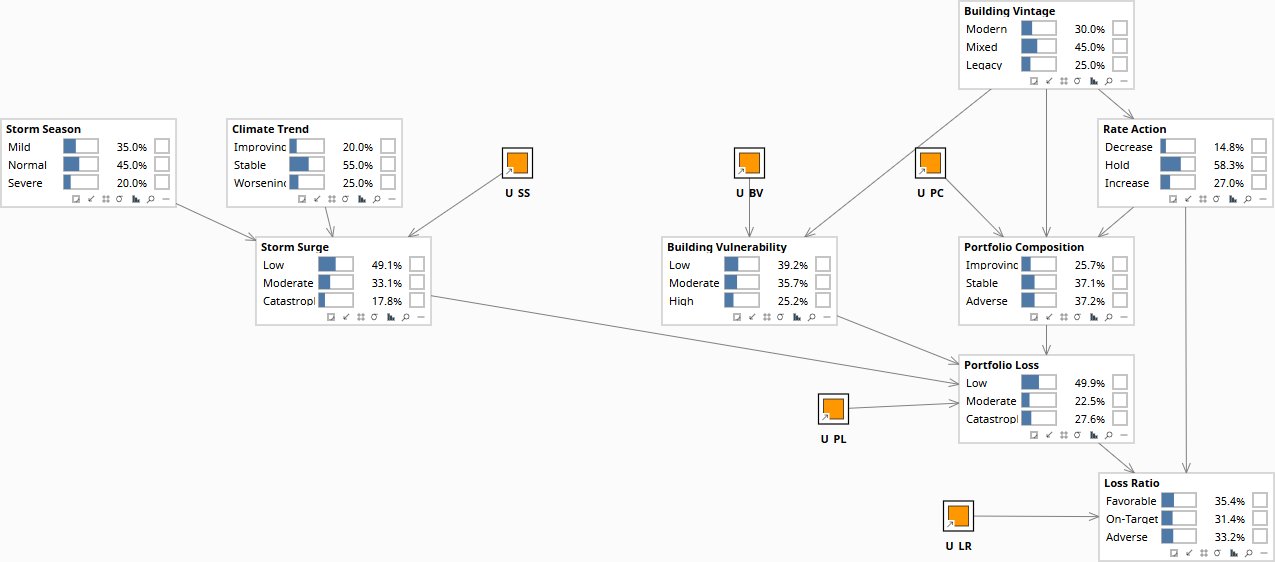
Loss Ratio at prior: 35.4% Favorable / 31.4% On-Target / 33.2% Adverse. Portfolio Loss: 49.9% Low / 22.5% Moderate / 27.6% Catastrophic.
Download the Models
All models require Bayes Server (free edition available). See Download Models for the full library.
Every organization has a decision where the register gives no guidance, the experts disagree, and the stakes justify getting it right. A focused conversation identifies that decision -- and scopes the first causal model to answer it.
The models are free. What I provide is the judgment to build the right structure for your specific situation, encode your experts’ knowledge into it, and turn the output into decisions your board can act on. The discipline stays with your team.