Why a Causal Model
The standard self-insurance feasibility study sums five years of premiums, sums five years of losses capped at the proposed retention level, and computes the difference. If premiums exceed retained losses, self-insurance looks attractive. This analysis contains a structural error: it assumes the loss distribution under self-insurance would have been identical to the loss distribution under the insured arrangement. That assumption is false in a specific, identifiable way. Financing arrangement is causally upstream of claims management intensity and loss control investment — both of which causally determine the loss distribution. When an organization retains risk, the full economic consequence of every loss falls on the retained loss line. Claims management becomes more aggressive. Loss control investment increases because the full benefit accrues internally. The counterfactual loss distribution is lower than the insured experience — not because of luck, but because the causal system changed.
| Analysis Component | Standard Approach | Causal Approach |
|---|---|---|
| Counterfactual losses | Observed insured losses (wrong) | Estimated under self-insured causal system |
| Claims management effect | Ignored | Modeled as causal mediator |
| Loss control effect | Ignored | Modeled as causal mediator |
| Behavioral incentive shift | Not in model | Root node in causal graph |
| Premium savings reinvestment | Assumed zero | Explicit node: Loss Control Investment |
| Execution risk | Not quantified | Explicit node with probability distribution |
| Total cost of risk | Premium vs. loss comparison | Expected value over full causal distribution |
The Questions
- Would we have been better off if we had self-insured from the start? — Rung 3 (Counterfactual). Answering it requires abduction to condition on actual past losses with Organizational Risk Maturity as the confounder that selection bias opens when the standard analysis observes rather than intervenes on the financing arrangement.
- What will happen to our Total Cost of Risk if we switch to self-insurance? — Rung 2 (Intervention). A do(Financing Arrangement = Self-Insured) query severs the back-door through Claims Department Capability and Industry Risk Profile, isolating the severity and frequency pathways independently from who tends to self-insure.
- Why is our current program underperforming projection? — Rung 1 (Association). The graph encodes which dependencies exist between loss control spend, claims management quality, and TCOR; entering observed evidence propagates root-cause probabilities across all connected nodes.
Reading the screenshots: a black check mark on a node means it has been set as observed evidence — a fact entered into the model, acting as a filter. A red check mark means it has been set as a do intervention — a decision applied to the model, severing the influence of its parents.
Reading the spec tables: each Run the Analysis block lists the exact steps to reproduce each screenshot in Bayes Server. The Obs / Do column uses three italic control tokens: clear — reset the model to a blank no-evidence state; abduction step — enter the factual observations that anchor the U nodes to this specific case; use abduction result — apply a do() intervention with the U nodes held from the abduction step.
Would we have been better off?
“Given the losses we actually experienced over the past five years, would our total cost of risk have been lower under self-insurance?”
This conditions on actual past loss events and asks what would have happened under a different financing arrangement. It cannot be answered by comparing premiums to losses, because the losses themselves would have been different. It requires a Rung 3 counterfactual: compute P(TCOR | do(FA = Self-Insured)) and contrast it with the selection-biased P(TCOR | obs(FA = Self-Insured)).
Probably yes — but less than your feasibility study suggests, and only if the program is executed. The causal model puts the probability of Total Cost of Risk being below the insured baseline at 45%. The standard actuarial comparison overstates this at 47% — a 2 percentage point gap that arises because higher-maturity organizations are more likely to self-insure and more likely to manage claims well regardless of financing arrangement. Comparing their outcomes to insured organizations conflates who they are with what self-insurance does. If the program is approved but execution fails — premium savings absorbed as margin, claims management intensity unchanged — the probability of being below baseline falls to 39%.
| Image | Obs / Do | Node | Set | Result |
|---|---|---|---|---|
| si-cf-1-prior | — | Counterfactual Loss | 40.8% Below Baseline | |
| — | Total Cost of Risk | 38.7% Below Baseline | ||
| si-cf-2-do | do | Financing Arrangement | Self-Insured | |
| — | ORM (back-door severed) | 30/45/25 — at prior | ||
| — | Total Cost of Risk | 45.0% Below Baseline | ||
| si-cf-3-obs | obs | Financing Arrangement | Self-Insured | |
| — | ORM High (updated) | 44.5% from 25% | ||
| — | Counterfactual Loss | 48.2% Below — overstated | ||
| si-cf-4-execution | do | Financing Arrangement | Self-Insured | |
| do | Execution Risk | Low | ||
| — | Total Cost of Risk | 38.3% Below Baseline |
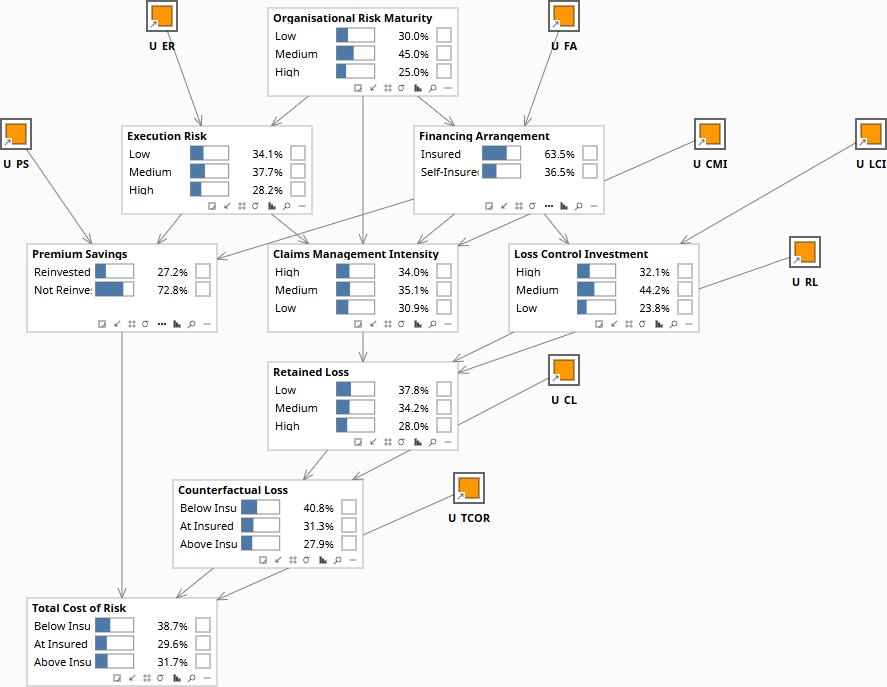
Baseline before any query. Financing Arrangement at market prior: 63.5% Insured, 36.5% Self-Insured.
What will happen if we switch?
“If we switch to self-insurance at the next renewal, what will our expected total cost of risk be over the next five years — and which mechanism will drive the benefit?”
This is a Rung 2 intervention question: what happens when we set Financing Arrangement = Self-Insured? The mechanism model isolates the two causal pathways — claims management intensity driving severity reduction, and loss control investment driving frequency reduction — so the board can see which commitment is binding before approving the program.
The theoretical ceiling is a 45% probability of Counterfactual Loss below the insured baseline — but loss control investment is the dominant value driver, not claims management. Impairing loss control alone shifts the probability of being above baseline to 33.8%. Impairing claims management alone shifts it to 26.2%. The board's most important pre-approval commitment is therefore whether premium savings will actually be reinvested in loss prevention — not just whether the organization has a capable claims team.
| Image | Obs / Do | Node | Set | Result |
|---|---|---|---|---|
| si-be-5-full | do | Financing Arrangement | Self-Insured | |
| — | Counterfactual Loss | 45.2% Below Baseline | ||
| si-be-6-cmi | do | Financing Arrangement | Self-Insured | |
| do | CMI | Low | ||
| — | Early Intervention Rate | 76.5% Low | ||
| — | Counterfactual Loss | 40.6% Below / 26.2% Above | ||
| si-be-7-lci | do | Financing Arrangement | Self-Insured | |
| do | LCI | Low | ||
| — | Frequency Reduction | 63.2% Minimal | ||
| — | Counterfactual Loss | 31.9% Below / 33.8% Above |
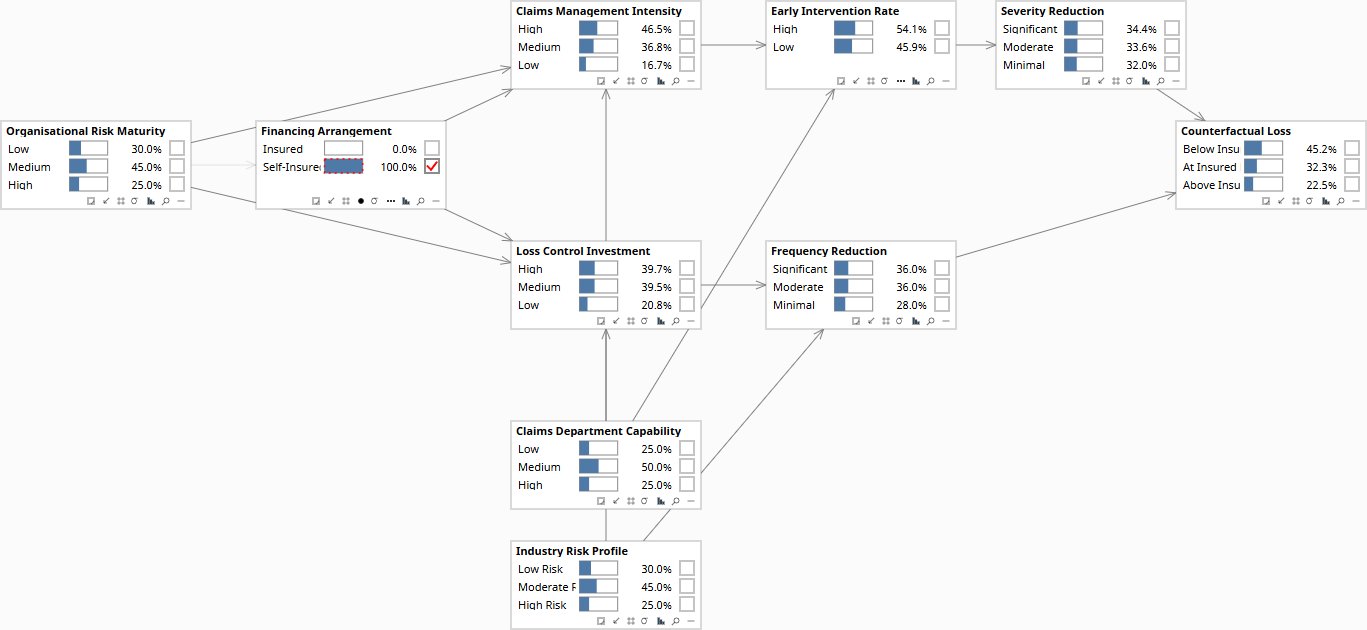
do(FA = Self-Insured), both pathways operating. This is the ceiling achievable only if both claims management and loss control commitments are fully honored.
Why is our program underperforming?
“Our self-insured TCOR is running above the feasibility study projection. Is this a bad year, a loss control failure, a claims management failure, or a mispriced program?”
This is a Rung 1 query — association and filtering, the kind a spreadsheet can perform. What makes it useful here is not the rung but the causal graph: only a correctly specified graph produces the right posterior over root causes. A regression or correlation analysis with the wrong structure gives you the wrong diagnosis and the wrong response. The graph encodes which dependencies exist — only the nodes genuinely connected to the evidence move.
Setting TCOR = Adverse alone does not identify the cause — but adding one piece of operational data shifts the diagnosis sharply. Without operational evidence, all four root causes update modestly and no single explanation dominates. Add loss control spend data and Loss Experience shifts toward High Frequency / Normal Severity: the problem is frequency, the fix is reinvestment. Add claims management quality data and Loss Experience shifts toward Both Elevated: the problem is severity development, the fix is operational. A board that demands this analysis before deciding whether to exit a program makes a materially better decision than one that exits on the loss number alone.
| Image | Obs / Do | Node | Set | Result |
|---|---|---|---|---|
| si-diag-8-prior | — | TCOR vs Projection | 34.5% Fav / 30.1% Adverse | |
| — | Adverse Loss Year | 20.0% Present | ||
| si-diag-9-adverse | obs | TCOR vs Projection | Adverse | |
| — | Adverse Loss Year | 26.6% Present | ||
| — | Retained Loss | 74.9% Above Projection | ||
| si-diag-10-lci | obs | Loss Control Investment | Insufficient | |
| — | Loss Experience | 37.9% High Freq / Normal Sev | ||
| si-diag-11-cmq | obs | Claims Mgt Quality | Low | |
| — | Loss Experience | 36.8% Both Elevated | ||
| — | Retained Loss | 77.4% Above Projection |
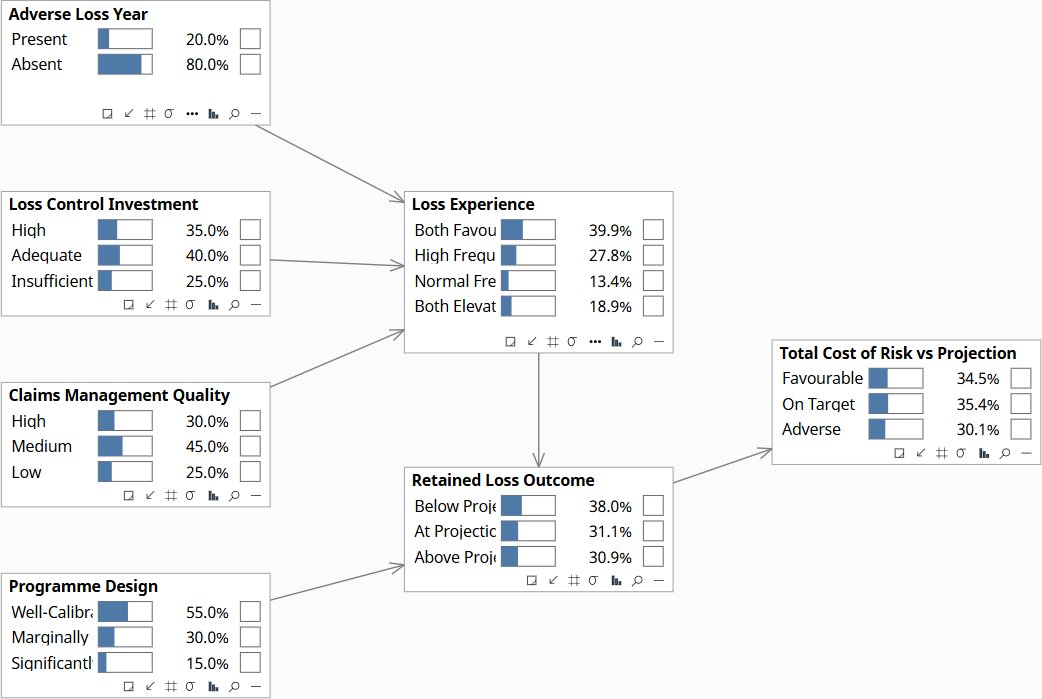
Root causes at prior base rates. TCOR vs Projection: 34.5% Favorable, 35.4% On Target, 30.1% Adverse.
The self-insurance decision spans the full causal ladder. The prospective question (what will happen if we switch?) is Rung 2 — a do() intervention on a forward-looking causal system. The retrospective question (would we have been better off?) is Rung 3 — it conditions on past events that cannot be rerun and requires a structural causal model with U nodes. The diagnostic question (why is our program underperforming?) runs on Rung 1 association — the kind a spreadsheet can perform — but produces the right answer only when the causal graph is correctly specified. The graph is doing the work, not the rung.
Download the Models
The output of a causal self-insurance analysis is a probability distribution over total cost of risk under self-insurance, with an explicit estimate of execution risk. That is what a board should approve — not a point estimate derived from five years of insured loss history. If you want to run this analysis against your own loss data, the models are below. If you want someone to run it with you, start a conversation (info@rung3.ai).
All models require Bayes Server (free edition available). See Download Models for the full library across all case studies.
Your risk manager knows whether the behavioral benefit of self-insurance is achievable given your claims management capability. That assessment needs to be in the model before the board approves the program — not discovered after two years of adverse development.
The models are free. What I provide is the judgment to build the right structure for your specific situation, encode your experts’ knowledge into it, and turn the output into decisions your board can act on. The discipline stays with your team.