Why a Causal Model
Utility reliability analysis typically works backward from events: a feeder failed, the SAIDI contribution is calculated, the inspection log is reviewed. The resulting report describes what happened. It does not answer the question the board is actually asking — whether the failure was preventable, which capital decisions are genuinely driving outage risk, and what the evidence on a symptomatic feeder is actually telling you. These are causal questions. They require a model of the system that generated the events, not just a record of the events themselves.
The confounding problem is structural. Capital budget pressure does not only cause deferral of formal replacement programs — it simultaneously reduces routine maintenance spend across the fleet. When a board observes that deferred utilities have higher outage rates, it is looking at two effects at once: the deferral itself, and the maintenance degradation that tends to accompany it. Treating these as one effect produces the wrong capex decision. A causal model holds the two pathways apart.
| Analysis Component | Standard Approach | Causal Approach |
|---|---|---|
| Post-event review | Documents what failed and when | Estimates what would have happened under different decisions |
| Capital deferral effect | Correlated with outage rate (confounded) | Isolated from maintenance degradation via do() intervention |
| Root cause diagnosis | Operations team opinion vs. asset team opinion | Posterior distribution over causes given observed fault data |
| Preventability assessment | Not quantified — narrative only | Counterfactual probability: P(failure | inspection on schedule) |
| Budget pressure effect | Not in the model | Explicit confounder node — its two pathways are separated |
The Questions
- The Ridgeline feeder failed during last August’s heat dome after an 18-month inspection deferral — would it have failed even if inspection had been on schedule? — Rung 3 (Counterfactual). Answering it requires abduction to anchor the actual heat dome severity, the asset’s age, and the observed failure before changing only the inspection decision; Asset Age and Load Stress are confounders that must be held at their actual values.
- If we defer the substation transformer replacement program by two years, what does that actually do to forced outage probability at peak summer load? — Rung 2 (Intervention). A do() query severs the confounding path from Capital Budget Pressure through the deferral decision, isolating the causal effect of the interval extension from the budget environment that tends to accompany it.
- A feeder serving a hospital district is showing elevated fault frequency — is this worse storms, aging infrastructure, or overdue vegetation management corridors? — Rung 1 (Association). The graph encodes which dependencies exist between Weather Severity, Asset Age, Vegetation State, and fault outcomes; entering the observed fault trend updates every genuinely connected upstream node, separating what the evidence supports from what each team is asserting.
Reading the screenshots: a black check mark on a node means it has been set as observed evidence — a fact entered into the model, acting as a filter. A red check mark means it has been set as a do intervention — a decision applied to the model, severing the influence of its parents.
Reading the spec tables: each Run the Analysis block lists the exact steps to reproduce each screenshot in Bayes Server. The Obs / Do column uses three italic control tokens: clear — reset the model to a blank no-evidence state; abduction step — enter the factual observations that anchor the U nodes to this specific case; use abduction result — apply a do() intervention with the U nodes held from the abduction step.
Would the Ridgeline feeder have failed anyway?
“The Ridgeline feeder failed during last August’s heat dome. We deferred its inspection by 18 months. Would it have failed even if inspection had been on schedule?”
This question conditions on a specific past event — a real feeder, a real storm — and asks what a different decision would have changed. It cannot be answered by comparing deferred feeders to on-schedule feeders in the data, because the feeders that get deferred are already different: they tend to be in constrained-budget corridors where routine maintenance is also lower. The model separates those two effects. It then anchors itself to the background of this specific feeder — the things that were true about it that are not in the data — by entering the actual failure as observed evidence. Only once those background conditions are fixed does it ask: in this specific situation, with this specific feeder, what would the inspection have changed?
The U nodes (shown in orange in the model) represent those unobserved background factors — wildlife contact history, latent insulation weakness, localized corrosion — that are particular to this asset. They persist into the counterfactual world unchanged. This is what makes the answer individual rather than statistical: it is not asking what inspection does on average, but what it would have done here.
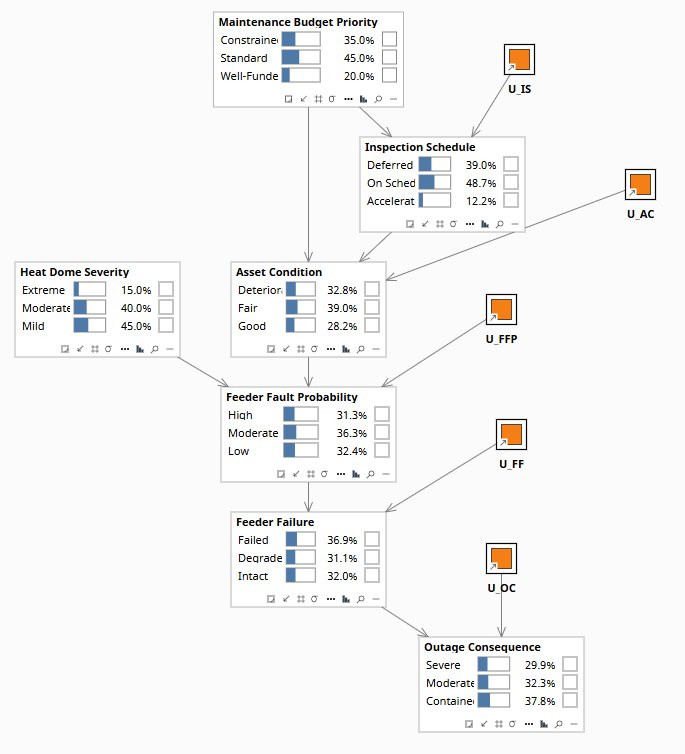
Probably yes — and the inspection would have made a difference, but not enough to prevent it. With only the heat dome entered, failure probability rises to 53.8% — the feeder was already in serious jeopardy before the inspection question is asked. Entering the actual failure as evidence (abduction) shifts Asset Condition to 38.9% Deteriorated and Inspection Schedule infers 41.4% Deferred — the model reconstructs the background of this specific asset from what actually happened. Forcing inspection to On Schedule in the counterfactual world improves Asset Condition to 31.6% Deteriorated — a meaningful 7-point reduction. But Outage Consequence stays at 57.0% Severe, because the feeder's failure is still anchored and the heat dome remains extreme. The honest answer: the inspection gap worsened the asset's condition in a material way, but the underlying heat exposure and the feeder's pre-existing state meant failure was the dominant outcome regardless. The deferral was not the cause — it was a missed chance to reduce a risk that was already severe.
| Image | Obs / Do | Node | Set | Result |
|---|---|---|---|---|
| ugr-c-1 | — | Feeder Failure | 36.9% Failed / 31.1% Degraded / 32.0% Intact | |
| — | Outage Consequence | 29.9% Severe / 32.3% Moderate / 37.8% Contained | ||
| ugr-c-2 | obs | Heat Dome Severity | Extreme | |
| — | Feeder Fault Probability | 60.6% High | ||
| — | Feeder Failure | 53.8% Failed / 27.4% Degraded / 18.8% Intact | ||
| — | Outage Consequence | 38.1% Severe | ||
| ugr-c-3 | obs | Heat Dome Severity | Extreme | |
| obs | Feeder Failure | Failed | ||
| — | Asset Condition | 38.9% Deteriorated (from 32.8%) | ||
| — | Inspection Schedule | 41.4% Deferred (from 39.0%) | ||
| — | Outage Consequence | 57.0% Severe | ||
| ugr-c-4 | obs | Heat Dome Severity | Extreme | |
| obs | Feeder Failure | Failed | ||
| do | Inspection Schedule | On Schedule | ||
| — | Asset Condition | 31.6% Deteriorated (from 38.9%) | ||
| — | Outage Consequence | 57.0% Severe (unchanged) |
Fleet-level baseline before any evidence. Feeder Failure: 38.2% Failed, 27.6% Degraded, 34.2% Intact. Outage Consequence: 28.4% Severe.
What does deferring transformer replacement actually cause?
“If we defer the substation transformer replacement program by two years to manage capital spend, what happens to the probability of a forced outage at peak summer load — and how much of that risk is the deferral itself versus the budget environment it comes from?”
When a board observes that utilities with deferred replacement programs have higher outage rates, it is seeing two things at once. Capital budget pressure independently reduces routine maintenance spend — so deferred programs arrive with degraded maintenance quality already baked in. Simply observing deferred programs in the data conflates those two effects. The model separates them: setting the program as deferred via the observation tells you what deferred programs tend to look like; forcing the program to deferred via intervention tells you what deferral alone would cause, holding maintenance quality at whatever it would have been. The gap between those two numbers is the confound the board needs to understand before it decides.
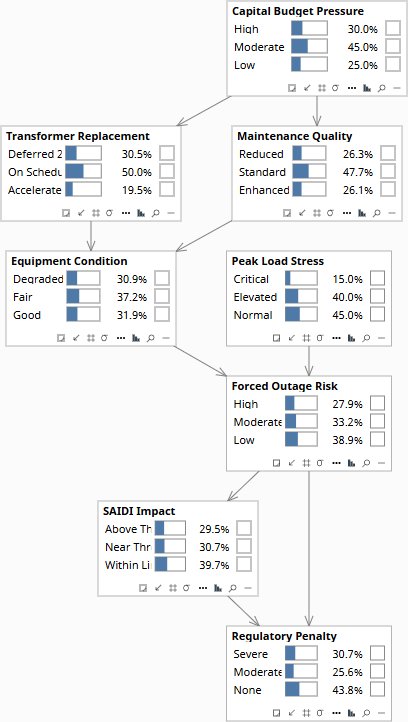
Deferral itself raises forced outage risk by 9.8 percentage points — from 27.9% to 37.7% High — but the confound from observational data is smaller than intuition suggests. Observing deferral (telling the model a deferral has been recorded) raises High outage risk to 39.5%, because the model infers that budget pressure is probably elevated (59.0% High) and maintenance quality probably reduced (40.0% Reduced) — the conditions that tend to accompany deferral. Forcing deferral via intervention, while holding budget pressure and maintenance at their natural levels, gives 37.7% High: a 1.8-point gap between what the data shows and what deferral alone causes. The confound is real but modest. What is not modest is the interaction with peak load: do(Deferred) under critical summer load pushes High outage risk to 67.3% and Severe regulatory penalty to 56.3%. The right board conversation is therefore less about whether the data overstates the deferral effect, and more about whether this program is being deferred into a summer where the grid cannot absorb the consequence.
| Image | Obs / Do | Node | Set | Result |
|---|---|---|---|---|
| ugr-i-1 | — | Forced Outage Risk | 27.9% High / 33.2% Moderate / 38.9% Low | |
| — | Regulatory Penalty | 30.7% Severe / 25.6% Moderate / 43.8% None | ||
| ugr-i-2 | obs | Transformer Replacement | Deferred 2yr | |
| — | Capital Budget Pressure | 59.0% High (from 30.0%) | ||
| — | Maintenance Quality | 40.0% Reduced (from 26.3%) | ||
| — | Equipment Condition | 59.0% Degraded | ||
| — | Forced Outage Risk | 39.5% High | ||
| — | Regulatory Penalty | 39.1% Severe | ||
| ugr-i-3 | do | Transformer Replacement | Deferred 2yr | |
| — | Capital Budget Pressure | 30.0% High (unchanged — confounder severed) | ||
| — | Maintenance Quality | 26.3% Reduced (unchanged) | ||
| — | Equipment Condition | 54.2% Degraded | ||
| — | Forced Outage Risk | 37.7% High | ||
| — | Regulatory Penalty | 37.9% Severe | ||
| ugr-i-4 | do | Transformer Replacement | Deferred 2yr | |
| obs | Peak Load Stress | Critical | ||
| — | Forced Outage Risk | 67.3% High | ||
| — | Regulatory Penalty | 56.3% Severe |
Fleet baseline before any query. Forced Outage Risk: 30.2% High, 35.8% Moderate, 34.0% Low.
What is actually driving elevated fault frequency on this feeder?
“A feeder serving a hospital district is showing elevated fault frequency this quarter. The operations team says it’s worse storms. The asset team says it’s aging infrastructure. Vegetation management says the corridors are overdue. What does the evidence say?”
At Rung 1 the model runs as a filter: enter what you know about this feeder, read which root causes become more probable. Two confounders in the graph — Seasonal Conditions and Maintenance Budget Sufficiency — are what make the diagnostic discriminate between the three teams rather than just updating each cause proportionally. Seasonal Conditions independently drives both Thermal Loading and Vegetation Encroachment: a hot wet season raises both at once. Maintenance Budget Sufficiency independently drives both Equipment Deterioration and Vegetation Encroachment: constrained budgets cut both asset maintenance and corridor clearing simultaneously. Vegetation Encroachment therefore sits at the intersection of both confounders — confirming it as the cause updates beliefs about season and budget, which propagates to the other two causes. Confirming Thermal Loading above capacity updates season strongly but leaves budget near its prior. The two confirmations produce different footprints across the graph — and that difference tells the board whose hypothesis most fits the full picture.
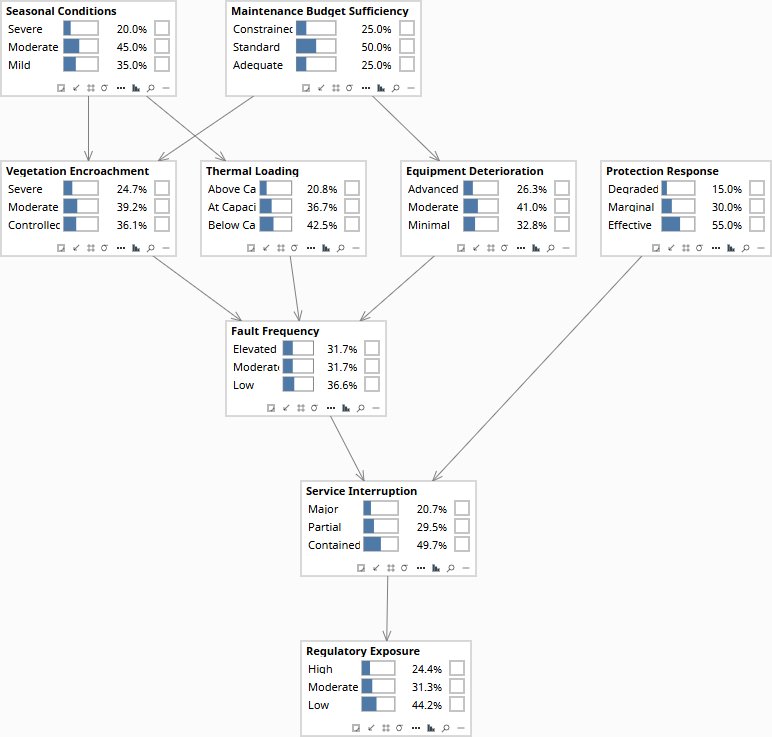
Elevated fault frequency alone shifts all three causes upward but names no single culprit — and the two additional data points produce genuinely different diagnostic signatures. With only Fault Frequency = Elevated entered, Seasonal Conditions rises to 33.7% Severe, Maintenance Budget Sufficiency to 35.4% Constrained, Vegetation to 45.4% Severe, Thermal to 37.1% Above Capacity, and Equipment to 40.6% Advanced. All three teams remain plausible. Confirming Vegetation = Severe then pulls Seasonal Conditions to 49.9% Severe (raising Thermal to 44.2% Above Capacity) and Maintenance Budget to 44.1% Constrained (raising Equipment to 41.7% Advanced) — because vegetation sits at the intersection of both confounders. Confirming Thermal = Above Capacity instead pulls Seasonal Conditions harder (67.0% Severe) but leaves Maintenance Budget near its prior (30.7% Constrained), raising Vegetation to 54.1% but leaving Equipment only at 34.5% Advanced. The load team's claim points to a seasonal problem; the vegetation team's claim points to both a seasonal and a budget problem. Those are different operational responses — and the model makes the difference explicit before any inspection is commissioned.
| Image | Obs / Do | Node | Set | Result |
|---|---|---|---|---|
| ugr-d-1 | — | Fault Frequency | 31.7% Elevated / 31.7% Moderate / 36.6% Low | |
| — | Service Interruption | 20.7% Major | ||
| — | Regulatory Exposure | 24.4% High | ||
| ugr-d-2 | obs | Fault Frequency | Elevated | |
| — | Seasonal Conditions | 33.7% Severe (from 20.0%) | ||
| — | Maintenance Budget Sufficiency | 35.4% Constrained (from 25.0%) | ||
| — | Vegetation Encroachment | 45.4% Severe | ||
| — | Thermal Loading | 37.1% Above Capacity | ||
| — | Equipment Deterioration | 40.6% Advanced | ||
| — | Service Interruption | 45.0% Major | ||
| ugr-d-3 | obs | Fault Frequency | Elevated | |
| obs | Vegetation Encroachment | Severe | ||
| — | Seasonal Conditions | 49.9% Severe | ||
| — | Maintenance Budget Sufficiency | 44.1% Constrained | ||
| — | Thermal Loading | 44.2% Above Capacity | ||
| — | Equipment Deterioration | 41.7% Advanced | ||
| — | Regulatory Exposure | 43.5% High | ||
| ugr-d-4 | obs | Fault Frequency | Elevated | |
| obs | Thermal Loading | Above Capacity | ||
| — | Seasonal Conditions | 67.0% Severe | ||
| — | Maintenance Budget Sufficiency | 30.7% Constrained | ||
| — | Vegetation Encroachment | 54.1% Severe | ||
| — | Equipment Deterioration | 34.5% Advanced | ||
| — | Regulatory Exposure | 43.5% High |
Root causes at prior marginals. Fault Frequency: 29.8% Elevated, 41.6% Moderate, 28.6% Low. Service Interruption: 28.3% Major.
Download the Models
All models require Bayes Server (free edition available). See Download Models for the full library across all case studies.
Your asset management team knows which feeders are symptomatic and which capital programs are under pressure. That knowledge needs to be in a causal model before the next board capital approval — not discovered in the post-event review.
The models are free. What I provide is the judgment to build the right structure for your specific network, encode your engineers’ knowledge into it, and turn the output into decisions your board can act on. The discipline stays with your team.