Why a Causal Model
Utility-caused wildfire follows a textbook directed acyclic graph. Equipment condition determines whether a conductor fails during high winds. Wind severity and vegetation proximity determine whether a failed conductor produces ignition. Ignition determines whether a catastrophic fire results. Under California's inverse condemnation doctrine, liability is the downstream consequence of the entire causal chain — not of negligence, but of causation. A risk score gives the board a number. The causal model gives the board a mechanism: which equipment decision, on which span, would have changed which outcome, by how much.
The model also reveals the central confound in observational PSPS analysis. Utilities de-energise lines during Red Flag Warning conditions — the same conditions that drive high wind severity. Any analysis that treats PSPS status as observed rather than intervened on will systematically underestimate the protective effect of de-energisation, because the observed data conflates the intervention with the weather that triggered it. Only the do() operator severs this back-door path.
| Analysis Component | Standard Approach | Causal Approach |
|---|---|---|
| Where does ignition risk concentrate? (Rung 1) | “Wildfire: High” — one risk score for the entire portfolio; no conditional structure | Enter what you know; the graph encodes which nodes are genuinely connected, so only those update — no spurious propagation |
| What does de-energising lines deliver? (Rung 2) | PSPS thresholds set by policy; observational data conflates de-energisation with the extreme weather that triggered it, understating the true protective effect | do(PSPS = De-energised) severs the back-door path from Red Flag Warning through PSPS — Red Flag Warning stays at its prior, isolating the true causal effect |
| Would this fire have occurred with the fitting replaced? (Rung 3) | Cannot answer — liability requires proof of causation, not correlation; risk scores offer no mechanism for conditioning on specific past events | Abduct U_EC from factual conditions (Red Flag Extreme, Incident History Severe, Equipment Failed), then apply do(Equipment Condition = Good) — ignition probability drops from 12.1% to 2.9% |
The Questions
- Would this fire have occurred if the fitting had been replaced? — Rung 3 (Counterfactual). Answering it requires abduction to condition on the specific event’s Red Flag Warning, incident history, and equipment age, then changing the maintenance decision to isolate what would have changed for this circuit on that day.
- What does de-energising lines actually deliver in terms of ignition probability reduction? — Rung 2 (Intervention). A do(PSPS = De-energised) query severs the back-door path from Red Flag Warning through the PSPS trigger, removing the confounder that causes observational data to understate the true protective effect.
- Where does ignition risk concentrate across the circuit portfolio? — Rung 1 (Association). The graph encodes which dependencies exist between weather, equipment age, and ignition outcome; entering observed evidence filters to the upstream states most consistent with a high-liability outcome, without claiming those states caused it.
Reading the screenshots: a black check mark on a node means it has been set as observed evidence — a fact entered into the model, acting as a filter. A red check mark means it has been set as a do intervention — a decision applied to the model, severing the influence of its parents.
Reading the spec tables: each Run the Analysis block lists the exact steps to reproduce each screenshot in Bayes Server. The Obs / Do column uses three italic control tokens: clear — reset the model to a blank no-evidence state; abduction step — enter the factual observations that anchor the U nodes to this specific case; use abduction result — apply a do() intervention with the U nodes held from the abduction step.
Would this fire have occurred if the fitting had been replaced?
“Given everything that was true on the day of the ignition — the Red Flag Warning, the incident history of this circuit, the age of the equipment — would this fire have occurred if the specific fitting that failed had been in good condition?”
Rung 2 tells you what replacing equipment does on average across all circuits and weather conditions. Courts ask a narrower question: given this specific circuit, this specific weather, this specific incident history — what would have happened if that fitting had been in good condition? The answer is not the same as the average.
Replacing the fitting would have substantially reduced ignition probability — but not to zero. Given the extreme Red Flag conditions and this circuit's incident history, the model says ignition probability drops from 12.1% to 2.9% under the counterfactual. The fire might still have occurred. That is the honest answer, and it is the answer a court needs: not a yes or no, but a probability with explicit assumptions about what else was true that day.
| Image | Obs / Do | Node | Set | Result |
|---|---|---|---|---|
| wf3-1-prior | — | Ignition Event | 73.0% No / 17.2% Probable / 9.8% Certain | |
| — | Liability | 75.6% Low / 12.9% Med / 11.5% High | ||
| wf3-5-abduction | obs | Red Flag Warning | Extreme | |
| obs | Incident History | Severe | ||
| obs | Equipment Condition | Failed | ||
| — | U_EC | 37.4% Fav / 52.6% Adv — no longer flat | ||
| — | Ignition Event | 87.9% No / 7.4% Probable / 4.7% Certain | ||
| — | Liability | 86.2% Low / 7.9% Med / 5.9% High | ||
| wf3-6-do-ec-good | do | Equipment Condition | Good | |
| — | Ignition Event | 97.1% No / 2.3% Probable / 0.6% Certain | ||
| — | Liability | 93.0% Low / 5.1% Med / 1.9% High |
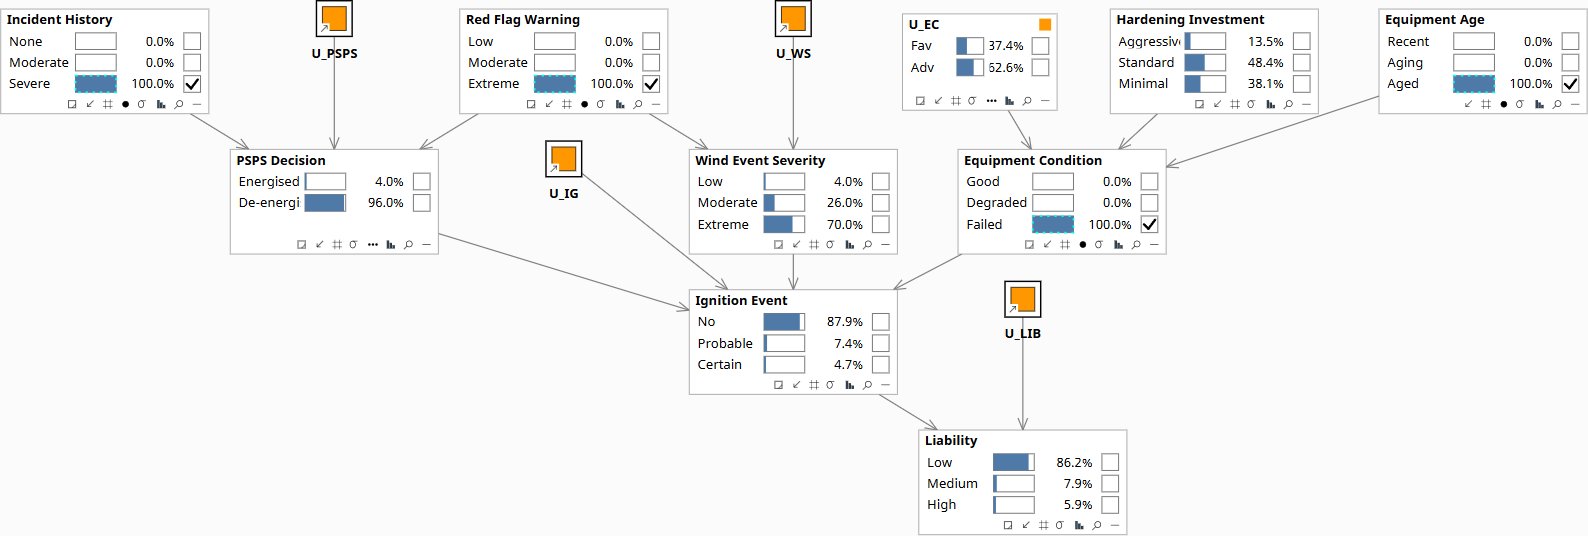
U_EC shifts from flat 50/50 to 37.4% Fav / 52.6% Adv — the background of this specific circuit is now encoded. The factual event conditions are fixed for the counterfactual query in Step 2.
What does de-energising lines actually deliver?
“If we de-energise a circuit during a Red Flag Warning event, how much does that actually reduce ignition probability — and does observational data from past PSPS events give us an accurate estimate of the causal effect?”
The PSPS trigger creates a structural confound. Lines are de-energised during the same Red Flag Warning events that drive high wind severity and ignition risk. Any dataset that uses PSPS status as observed — whether de-energised or energised — inherits the weather signal: de-energised circuits are disproportionately the circuits facing the worst conditions. Setting PSPS = De-energised as an intervention severs that back-door path through Red Flag Warning, holding the weather distribution at its prior. The gap between the two estimates shows the model isolating what de-energisation itself causes from the conditions that trigger it.
De-energising a circuit during a Red Flag event collapses ignition probability to 97.4% No — but the true causal effect is slightly stronger than observational analysis alone would show. Observing de-energisation inflates Red Flag Warning to 42.5% Extreme, because the model infers you are probably on an extreme-condition day when de-energisation is recorded. Forcing de-energisation via the do() operator holds Red Flag at its prior (60% Low / 28% Mod / 12% Extreme), isolating the equipment-side effect: ignition falls to 97.4% No versus 96.7% No under observation. The 0.7-point gap is modest — the protective effect is robust regardless — but the confounder fingerprint is clearly visible. Any cost-effectiveness analysis of the PSPS program based on historical operations data inherits this bias and will understate the true causal reduction.
| Image | Obs / Do | Node | Set | Result |
|---|---|---|---|---|
| wf3-1-prior | — | Red Flag Warning | 60.0% Low / 28.0% Mod / 12.0% Extreme | |
| — | Ignition Event | 73.0% No / 17.2% Probable / 9.8% Certain | ||
| — | Liability | 75.6% Low / 12.9% Med / 11.5% High | ||
| wf3-3-psps-do | do | PSPS | De-energised | |
| — | Red Flag Warning | 60.0% Low / 28.0% Mod / 12.0% Extreme (at prior) | ||
| — | Ignition Event | 97.4% No / 2.1% Probable / 0.5% Certain | ||
| — | Liability | 93.2% Low / 5.0% Med / 1.8% High | ||
| wf3-4-psps-obs | obs | PSPS | De-energised | |
| — | Red Flag Warning | 13.7% Low / 43.7% Mod / 42.5% Extreme | ||
| — | Ignition Event | 96.7% No / 2.6% Probable / 0.7% Certain | ||
| — | Liability | 92.8% Low / 5.2% Med / 2.0% High |
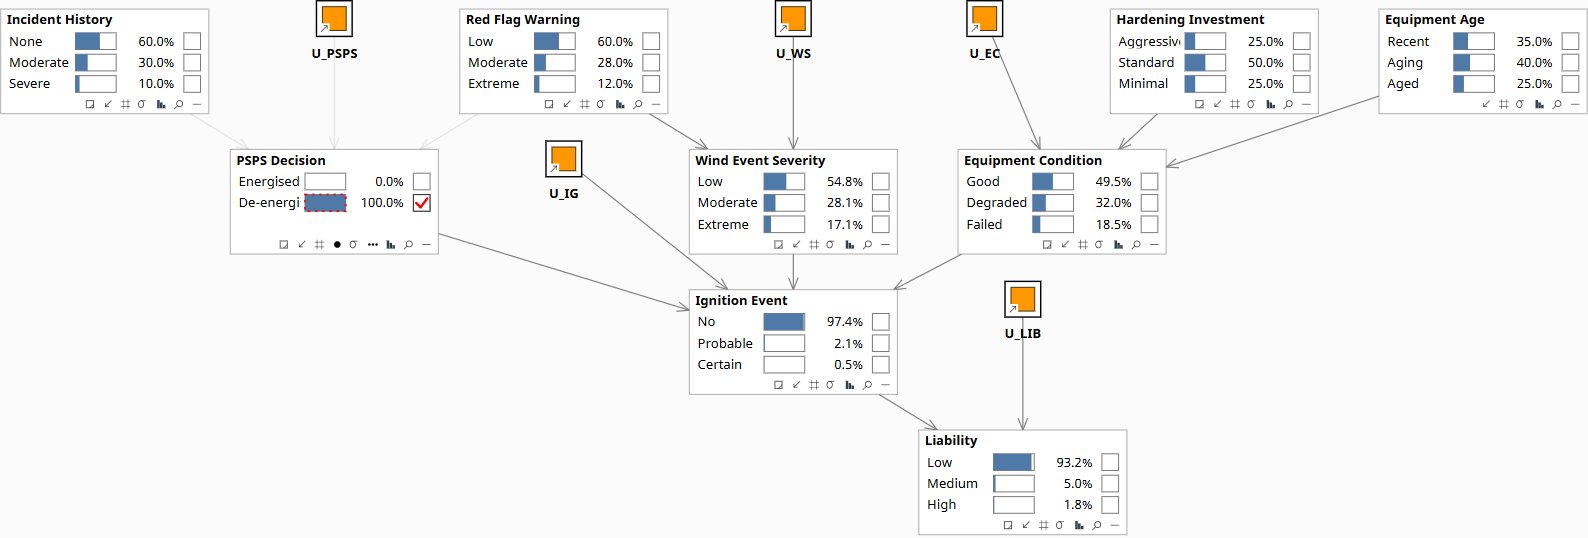
Back-door path from Red Flag Warning to PSPS severed. Red Flag Warning stays exactly at prior (60/28/12). Ignition collapses to 97.4% No. This is the true causal effect of de-energisation.
Where does ignition risk concentrate?
“A circuit is showing a high-liability incident. Equipment condition data is incomplete. Which upstream states — equipment deterioration, weather severity, incident history — are most consistent with what we observed, and where should inspection be directed?”
At Rung 1 the model runs as a diagnostic filter: enter what you know as observed evidence and read which upstream states become more probable. The result is not a causal claim — it identifies states consistent with what you observed, not what caused it. Two confounders in the graph — Red Flag Warning and Incident History — shape how evidence propagates: entering Liability = High implies extreme conditions and a history of prior incidents, which together update Equipment Condition far more than either alone. Each additional piece of evidence contributes additively, narrowing the diagnostic picture. This tells you where to focus inspection; Rung 2 tells you whether acting there changes the outcome.
Observing Liability = High shifts Equipment Condition Failed from 18.5% to 43.7% and raises Ignition = Certain to 61.4% — the graph propagates backward through the causal structure to identify upstream states consistent with a high-liability outcome. Each additional piece of observed evidence narrows the diagnostic picture further and additively. Adding Wind Event Severity = Extreme concentrates the equipment failure posterior to 51.7% and Ignition = Certain to 69.1%. Adding Incident History = Severe drives Equipment Failed to 58.7% and Ignition = Certain to 73.6%. The diagnostic tells you which circuits to inspect first; it does not assert that equipment failure caused the outcome — that is the counterfactual question answered in Rung 3.
| Image | Obs / Do | Node | Set | Result |
|---|---|---|---|---|
| wf3-1-prior | — | Equipment Condition | 49.5% Good / 32.1% Degraded / 18.5% Failed | |
| — | Ignition Event | 73.0% No / 17.2% Probable / 9.8% Certain | ||
| — | Liability | 75.6% Low / 12.9% Med / 11.5% High | ||
| wf3-2-liability-high | obs | Liability | High | |
| — | Equipment Condition | 19.8% Good / 36.4% Degraded / 43.7% Failed | ||
| — | Wind Event Severity | 46.5% Low / 32.4% Mod / 21.1% Extreme | ||
| — | Ignition Event | 6.4% No / 32.2% Probable / 61.4% Certain | ||
| wf3-diag-3-wind | obs | Wind Event Severity | Extreme | |
| — | Equipment Condition | 15.2% Good / 33.1% Degraded / 51.7% Failed | ||
| — | Ignition Event | 3.1% No / 27.8% Probable / 69.1% Certain | ||
| wf3-diag-4-incident | obs | Incident History | Severe | |
| — | Equipment Condition | 11.6% Good / 29.7% Degraded / 58.7% Failed | ||
| — | Ignition Event | 2.1% No / 24.3% Probable / 73.6% Certain |
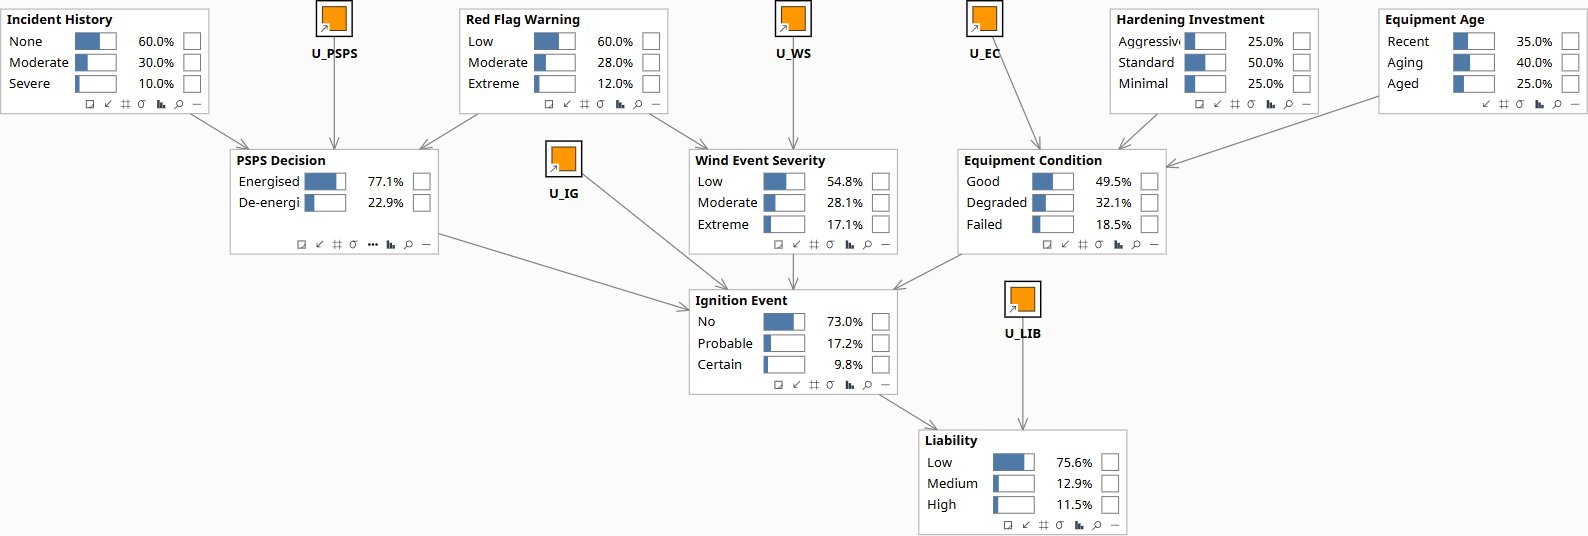
Baseline before any query. Equipment Condition: 49.5% Good / 32.1% Degraded / 18.5% Failed. Ignition: 73.0% No / 17.2% Probable / 9.8% Certain. Liability: 75.6% Low / 12.9% Med / 11.5% High.
Download the Models
All models require Bayes Server (free edition available). See Download Models for the full library.
If a fire starts from utility equipment tomorrow, the question will not be whether wildfire was on the risk register. It will be whether the investment decisions were the best use of available resources given what was knowable. The causal model provides that answer — before the fire, not after.
The models are free. What I provide is the judgment to build the right structure for your specific situation, encode your experts’ knowledge into it, and turn the output into decisions your board can act on. The discipline stays with your team.