This page is the buyer-facing view — the headline numbers, what the bridge tool produces, and what an engagement looks like. No code, no implementation detail, no methodology depth.
If you're an analyst evaluating whether the methodology is real rather than whether to engage, the Methods page covers the four-component architecture, the worked example with real Robyn output, and the file-by-file structure of the bridge.
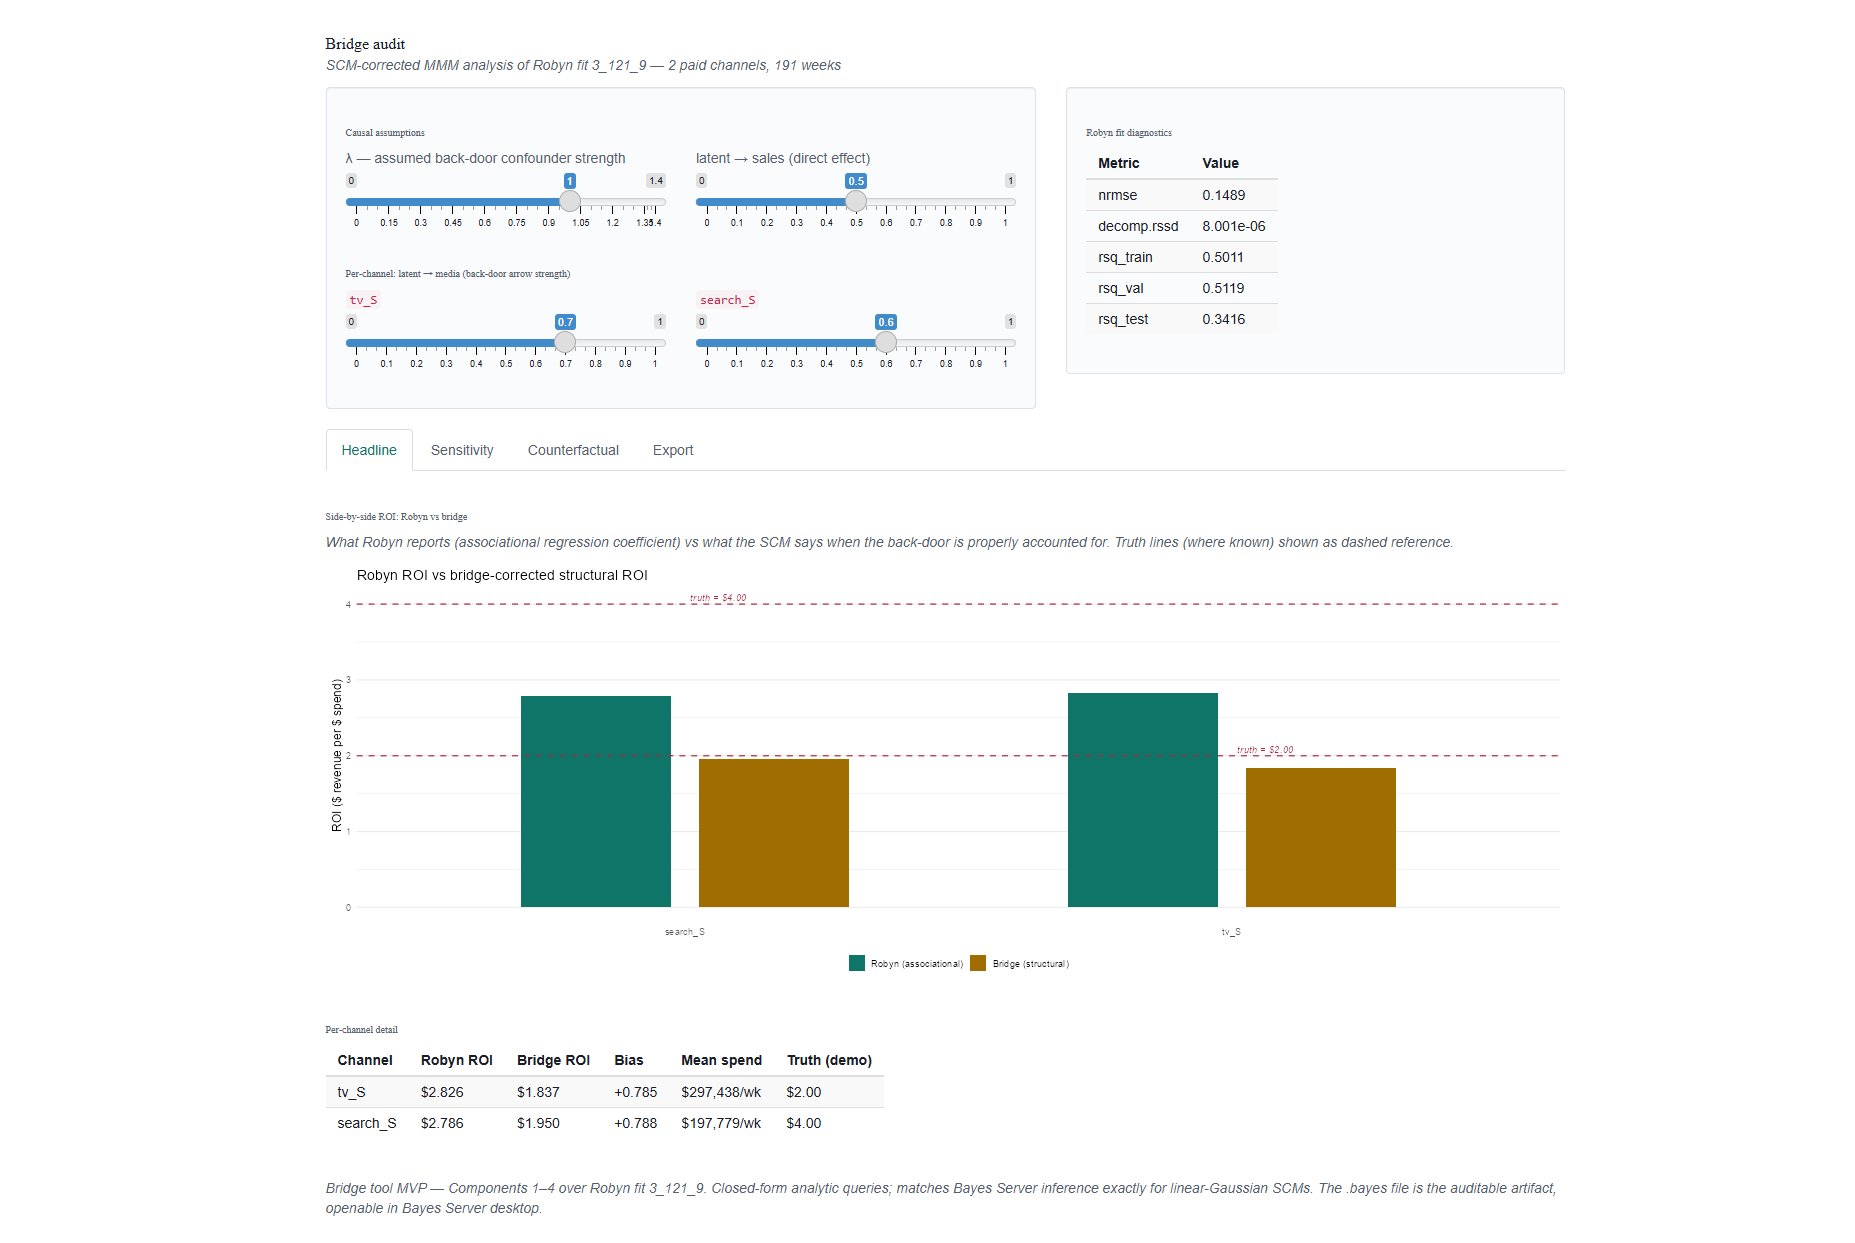
The headline
On a synthetic dataset where the true Marketing ROIs are knowable in advance, here is what a standard Robyn fit reports versus what a structural causal correction recovers:
On a $50M annual TV budget, Robyn's 41% over-statement implies roughly $20M of incremental revenue that won't materialize. The bridge brings the estimate within sampling noise of truth on TV — close enough for a planner to act on. Search illustrates the methodology's limits honestly: when Robyn's regularization shrinks a coefficient below truth (rather than above it), the bridge can correct back-door confounding but not regression shrinkage upstream. Both findings appear side by side in the audit, with no claim of uniform success.
Robyn is regression. The bridge adds the causal structure regression can't infer from data alone — the back-door confounder, the do-operator semantics, the counterfactual decomposition — and corrects each channel toward its true causal effect rather than its observed correlation.
The problem with regression-only MMM
Modern MMM tools are regressions of weekly sales on weekly media spend, with seasonality, holidays, and price as controls. They are statistically rigorous and produce well-calibrated confidence intervals. They are not causal models.
The gap matters because media spend is never randomly assigned. Advertisers spend more in Q4 because they expect Q4 sales. They push TV in growing markets because the markets are growing. They run promotions on responsive products because the products are responsive. A naive regression of sales on spend doesn't measure "where did sales lift because of money" — it measures "where did money go because we expected sales." The coefficient absorbs the strategic intent that drove the budget and reads it back as media effectiveness.
This is the back-door confounding problem. Every MMM has it. Robyn's response: experimental calibration where it's available (geo holdouts, lift studies) and ridge regularization elsewhere. Both are real defences. Neither is the same thing as a structural causal model.
The visible symptom: confidence intervals on individual channels of $0.73 to $7.42 per dollar of spend — wide enough to span "this is a great channel" and "this is a money pit." The point estimate that gets reported lands somewhere in the middle, but where exactly depends on the regularizer's trade-offs as much as on the data. The number that arrives in the budget meeting carries an apparent precision the underlying data doesn't support.
The bridge tool is the missing causal layer. It takes Robyn's fit, adds the structural assumptions the regression can't infer, and produces corrected ROIs alongside an explicit account of what depends on what.
What the bridge produces
Three deliverables, all interactive in a tool the marketing team uses for budget meetings.
Corrected ROIs per channel
The headline output. For every paid channel, the bridge reports Robyn's reported ROI alongside the structural ROI that accounts for the back-door confounder, with the size of the gap shown in dollars. Channels can be inflated, deflated, or roughly correct — the bridge tells you which is which, channel by channel.
Per-campaign attribution
For any historical campaign or burst, the bridge decomposes observed sales into the share causally attributable to the campaign versus the share that would have happened anyway because the underlying market was buoyant. The question Robyn structurally cannot answer; the question agency reviews and incentive-design need.
Sensitivity-analyzed allocation
A budget reallocation recommendation paired with an honest account of how it changes as the assumptions change. Drag a slider from "no confounder" to "strong confounder" and watch the optimal mix move. The recommendation that's stable across the range is the one the team can defend. The one that swings hard with the assumption is the one to keep arguing about.
What it looks like
The bridge ships as a Shiny app the marketing-analytics team operates on the consultancy's infrastructure. The team feeds in Robyn's quarterly output, the bridge produces the audit, the marketing leader walks the audit into the budget meeting:
The engagement
Four weeks. The first three are configuration; the fourth is delivery. The deliverable is a working bridge tool, configured for your business, plus a quarterly refresh cycle.
Situation and structure
Kickoff with marketing leadership, analytics, and finance. We map your media-planning process, channel taxonomy, and experimentation history. Output: a draft causal graph for your business and a data audit.
Priors and calibration
For each channel, we elicit a prior on its true causal elasticity from your experimental data and category benchmarks. Output: a defensible prior library and a calibration roadmap for the channels still missing experimental anchors.
Build, fit, diagnose
We build the SCM in Bayes Server, fit it against your historical Robyn output, and run six diagnostic checks. Output: a technical model report and a list of issues for review with your team.
Audit and handover
The CMO-facing audit report, a configured Shiny app for ongoing use, and an operating handover documenting the quarterly refresh cycle. Output: tooling your team owns and a methodology your team can defend.
Pricing band
For a single-geo, mid-market client (3–10 paid channels, 2–4 years of data, no major data-quality issues), the engagement runs $40–80K depending on data complexity and the quality of existing experimental calibration. Larger advertisers with multiple geos or 15+ channels run $80–150K over five to six weeks.
Quarterly refreshes — re-running the bridge against new Robyn fits, updating priors as new experiments come in, refreshing the audit — run $15–30K per quarter as a managed-service annuity. Most engagements convert into ongoing relationships once the first audit lands.
What you provide
One Robyn JSON file (or equivalent from Meridian, PyMC-Marketing, or another MMM tool we can read), a description of your media-planning process, and access to whatever experimental calibration data you already have. The rest is on us.
What you get
- The corrected MMM — your channel ROIs with the back-door confounder accounted for, ready to feed your budget process.
- The interactive tool — a Shiny app your team uses for ongoing analysis, with sensitivity sliders, scenario planning, and downloadable artifacts.
- The audit report — a written deliverable defensible at the CFO level, distinguishing what's robust from what's sensitive in your model.
- The .bayes file — your structural causal model, openable in Bayes Server, auditable by anyone who wants to inspect the assumptions.
- The methodology — documented enough that your team can extend, tune, and explain it without us.
Live demo
.bayes file or the audit CSV from the Export tab.Going deeper
If you're an analyst evaluating whether the methodology is real — or just curious how Robyn and the bridge actually fit together — the technical page covers the architecture, the file-by-file structure, the worked example with real Robyn output, and the four-component implementation that backs everything on this page.
If your team is running an MMM, the question worth asking isn't whether Robyn is right — it's how much your budget allocation depends on assumptions you didn't make explicit.
info@rung3.ai