The gap
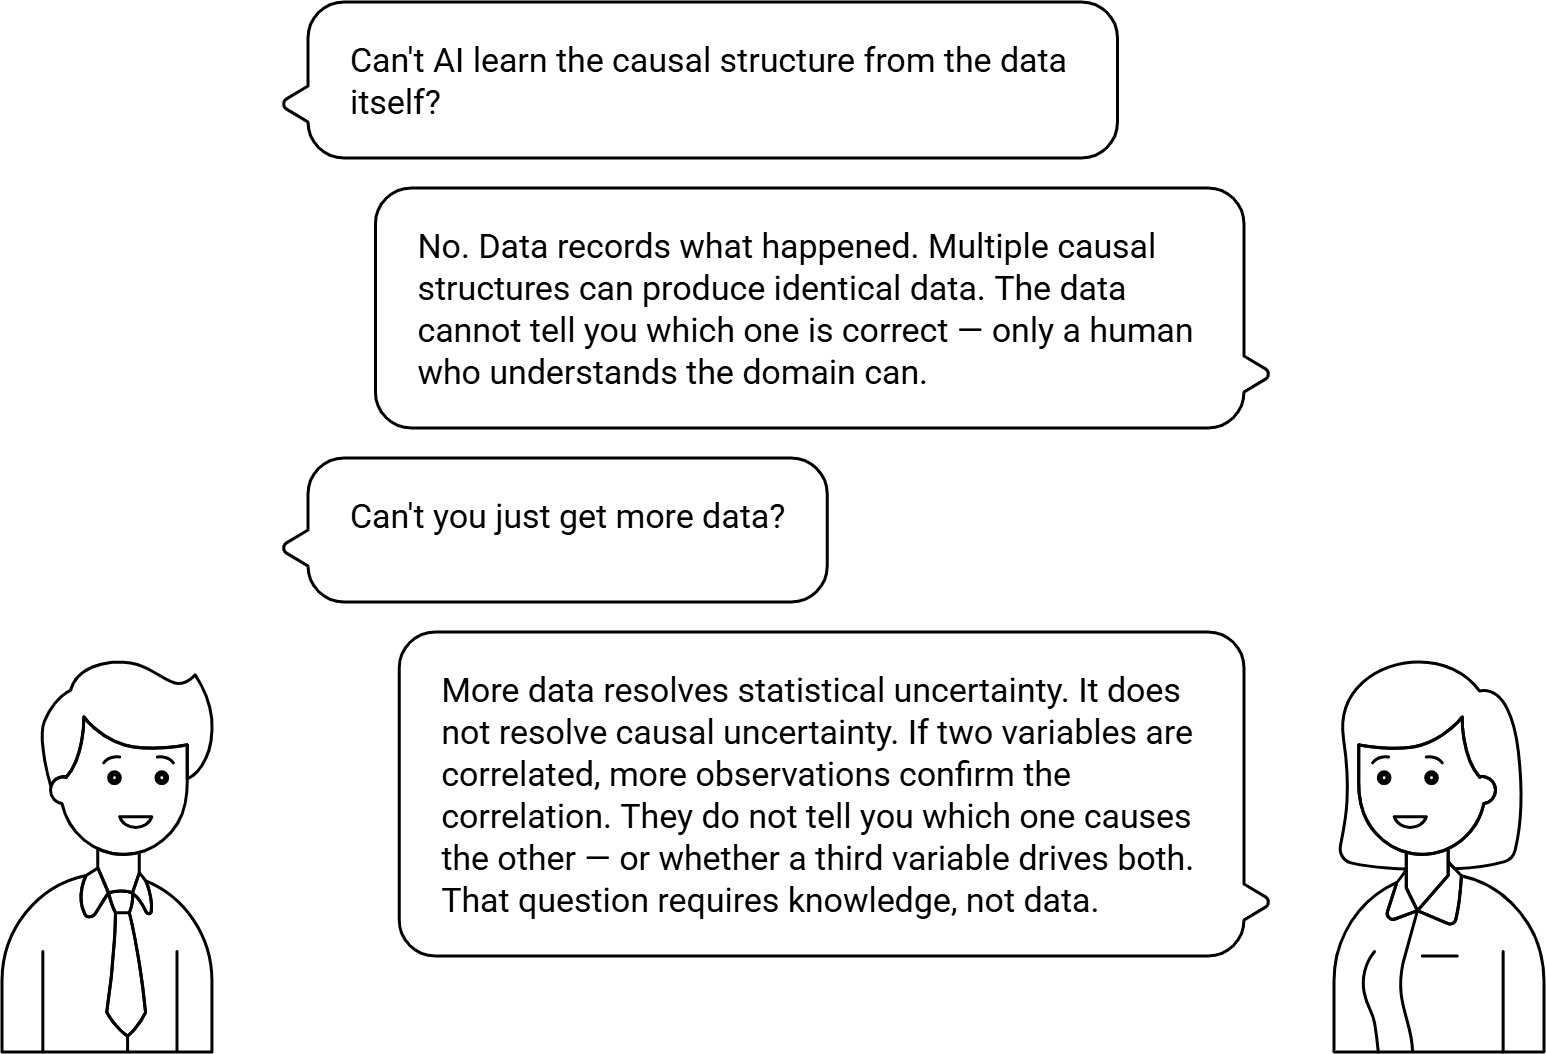
Data tells you what is correlated. It cannot tell you which direction causation runs, whether a third variable is driving both, or what would happen if you intervened. Two variables can be perfectly correlated whether A causes B, B causes A, or both are caused by a third variable entirely. The data looks identical in all three cases.
This is not a limitation of current statistical methods — it is a mathematical impossibility. The same joint probability distribution over a set of variables is consistent with multiple causal structures. Deciding which one is correct requires someone who understands the mechanism: a domain expert who knows not just that two variables are associated, but why they are.
That is the gap. The questions boards actually ask — did this control work? would a different decision have produced a different outcome? what would happen to this specific case if we changed this variable? — all require causal structure. No correlation-based tool can answer them, regardless of how much data it has access to.
The most sophisticated version of the observational-statistical apparatus — copulas, extreme value theory, multivariate GARCH, coherent risk measures — is developed in McNeil, Frey & Embrechts, Quantitative Risk Management (Princeton, 2005). None of it can answer “what would happen if we intervened?” That requires a different class of model.
What doesn't close it
LLMs are not causal models
LLMs generate text about cause and effect fluently — but generating text that sounds like causal reasoning is not the same as computing causal quantities. An LLM that tells you "implementing this control will reduce risk by 40%" is producing text shaped like a causal answer. It is not running the calculation. The number has no formal meaning, cannot be verified, and cannot be audited.
The correct architecture is to use an LLM as the interface to a causal model — translating plain-language questions into formal queries and returning computed results in plain language. Not to replace a causal model with an LLM.
Explainability tools are not causal models
SHAP values, LIME, and saliency maps tell you which input features a predictive model used to produce a prediction. They do not produce causal answers — because the underlying model they are explaining is itself a correlation model. Explaining a correlation is still a correlation. A feature importance score tells you what the model weighted. It does not tell you what caused the outcome, or what would happen if you intervened.
What does close it
How it's built
Humans reason causally by default. A domain expert who has spent twenty years in insurance underwriting does not describe correlations — they describe mechanisms. They know that flood proximity causes claim frequency, not merely that the two are associated. They know which direction the arrow runs, and why. That knowledge is exactly what the causal graph encodes.
The process is called knowledge elicitation. Three things make it harder than it sounds:
The result is a graph that domain experts can read, interrogate, and defend — because every arrow in it represents a claim they made. This is what makes causal models auditable in a way that trained models are not: the structure is its own documentation.
Building a library of Structural Causal Models (SCMs) from your domain experts’ knowledge — and making it queryable in plain language using an LLM — is an engagement.
Pearl, J., 2009, Causality: Models, Reasoning, and Inference (2nd ed.), Cambridge University Press · Pearl, J. & Mackenzie, D., 2018, The Book of Why, Basic Books · Peters, J., Janzing, D. & Schölkopf, B., 2017, Elements of Causal Inference, MIT Press