A randomized trial tells you the average treatment effect in a carefully selected population. A causal model tells you the individual treatment effect for the patient in front of you — conditioning on their full covariate history, including confounders that were never randomized. These are not the same question, and they do not have the same answer.
The Core Problem
Standard statistical models ask: What is the average treatment effect across a population? A trial recruits patients, randomizes treatment, and reports the mean outcome difference. That number is real and useful. But it is not the number a clinician needs when a specific patient — with a specific genomic profile, disease history, and comorbidity burden — sits across the desk. Personalized medicine asks something fundamentally harder: What will happen to this patient if I give them treatment A versus treatment B?
A Structural Causal Model (SCM) is the mathematical framework that makes that question answerable. An SCM encodes the data-generating process as a set of structural equations — each variable is a deterministic function of its direct causes plus a background noise term that captures all unmeasured heterogeneity. The graph tells you what causes what. The noise terms encode the irreducible differences between patients who look identical on every measured covariate.
The key consequence: randomness in an SCM does not come from the world being non-deterministic. It comes from hidden heterogeneity — the things we haven't measured. That reframing is what makes individual-level reasoning possible in principle, even if it remains constrained by data in practice.
The Ladder of Causation
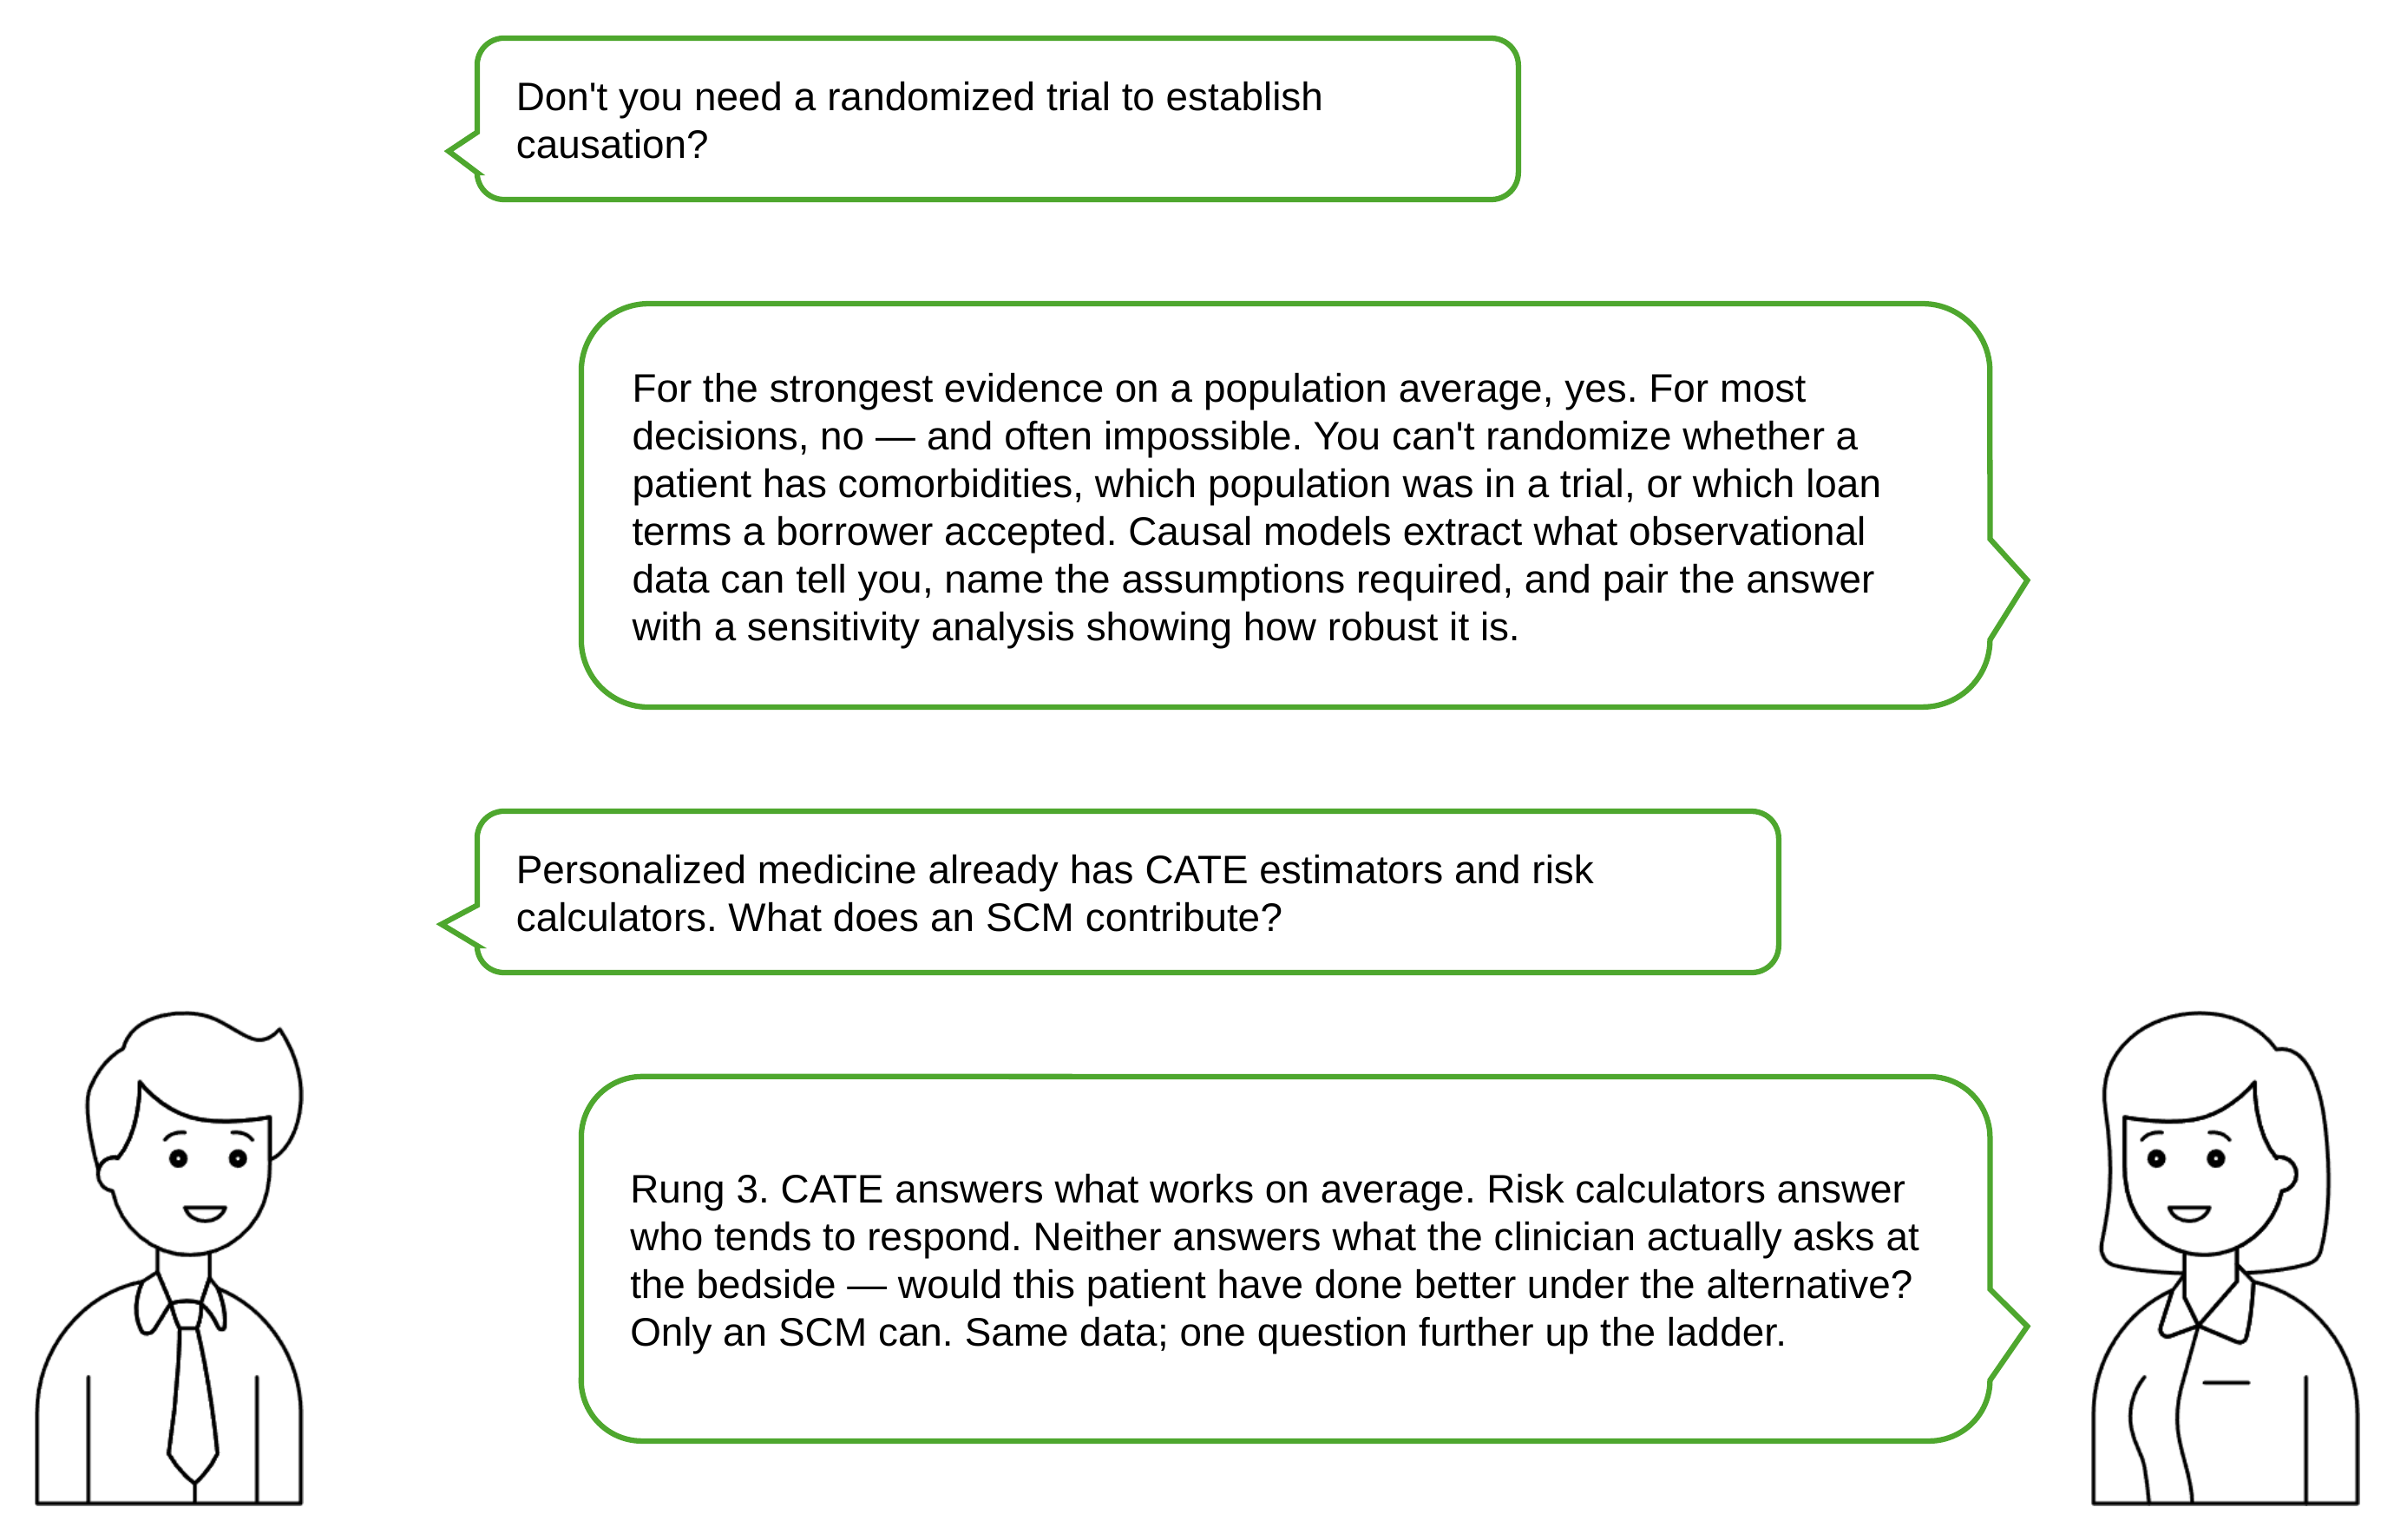
Judea Pearl's Causal Hierarchy organizes all statistical and causal questions into three rungs. Moving up the ladder requires stronger assumptions and, in return, answers harder clinical questions. Personalized medicine requires all three.
Association
Observing and filtering. The model uses conditional probability to update beliefs given new evidence. No causal direction is implied — evidence flows symmetrically through the graph. This is the rung of biomarker screening, risk scoring, and EHR-based prediction.
→ P(Y | X) · "Do patients on drug X tend to survive longer?"
Intervention
Acting on the world. The do-operator severs the influence of a variable's natural parents and sets it to a specified value. This isolates the causal effect of a decision from the confounders that tend to accompany it in observational data — the fundamental problem with naively learning from EHRs.
→ P(Y | do(X=x)) · "If I prescribe X, what is the expected outcome?"
Counterfactual
Reasoning about the path not taken. Given that this specific patient received treatment A and had outcome Y, what would have happened under treatment B? This requires abduction — using the observed outcome to infer the patient's background noise terms — before applying the hypothetical intervention. Only SCMs can answer Rung 3 questions.
→ P(Yx | X=x′, Y=y′) · "Would this patient have responded to a different regimen?"
You can never observe both potential outcomes for the same patient. The individual treatment effect τi = Yi(1) − Yi(0) is fundamentally unobservable — you can give or withhold treatment, but not both. Every method for personalized medicine is a principled strategy for making that missing counterfactual estimable under explicit assumptions.
Key Estimands
Individual Treatment Effect (ITE)
The ITE is the gold standard of personalized medicine: the difference in outcomes for patient i under treatment versus control.
The ITE is never directly observable (the fundamental problem above), but in an SCM it is well-defined: once the background noise Ui is pinned down via abduction, both potential outcomes can be computed by intervening on the treatment node. The ITE is what courts, regulators, and precision oncologists want — but its estimation requires strong assumptions about the functional form of the structural equations and the distribution of background noise.
Conditional Average Treatment Effect (CATE)
The CATE is the practical target for most personalized medicine applications: the expected treatment effect conditional on a patient's measured covariate profile X = x.
Unlike the ITE, the CATE is identifiable from observational data under standard causal assumptions (unconfoundedness, overlap, consistency). It answers: for patients who look like this, what is the average benefit of treatment? The CATE collapses individual heterogeneity within the covariate strata, but captures the heterogeneity across strata — which is often where the clinically actionable signal lives.
Counterfactual Outcome (SCM-specific)
The counterfactual outcome Yx(u) asks what the outcome would have been for a specific individual with background noise U = u, had we applied intervention do(X = x). This is computed via the abduction–action–prediction procedure:
Abduction
Use the observed evidence (the patient's actual history and outcome) to update the posterior distribution over background noise U. This pins the model to this specific patient's unobserved characteristics.
Action
Modify the structural model by applying the counterfactual intervention — for example, do(Treatment = Immunotherapy) even though the patient actually received chemotherapy. This severs the treatment node's connection to its parents.
Prediction
Propagate the modified model forward with the abducted U values held fixed to compute the counterfactual outcome. The difference from the observed outcome is the individual causal effect for this patient.
Estimation Methods
| Method | Core Idea | Best When | Limitation |
|---|---|---|---|
| T-Learner | Fit separate outcome models for treated and control groups; take the difference. | Large, balanced samples with clear treatment/control separation. | High variance when treatment groups differ substantially in size or covariate distribution. |
| S-Learner | Single outcome model with treatment as a feature; CATE from treatment coefficient. | When treatment effect is smooth and small relative to outcome variance. | Can regularize the treatment effect toward zero if it dominates noise. |
| X-Learner | Impute ITEs from each group using the other group's model; regress imputed ITEs on covariates. | Highly imbalanced treatment groups (common in EHR data). | Propagates outcome model errors into the ITE imputation stage. |
| DR-Learner | Doubly-robust: combines propensity score and outcome model; consistent if either is correctly specified. | Observational data with moderate confounding and known propensity model. | Requires correct specification of at least one nuisance model. |
| Causal Forest | Random forests adapted to minimize CATE estimation error via honest splitting. | High-dimensional covariates, nonlinear heterogeneity, no parametric assumptions. | Computationally expensive; inference requires bootstrap or asymptotic theory. |
| TARNet / CFRNet | Deep nets with shared representation layer; CFRNet adds IPM regularization to balance treated/control. | Large datasets, complex non-linear treatment heterogeneity, image or text covariates. | Requires large training sets; representation balancing can destroy predictive signal. |
| Proximal Causal Learning | Uses proxy variables to identify causal effects despite unmeasured confounders. | When hidden confounders are known to exist but cannot be measured directly. | Requires two sets of valid proxy variables, which are rarely available in practice. |
Handling Hidden Confounding
In EHR data, physicians prescribe based on factors that are not fully recorded. This creates unmeasured confounding that can bias any CATE estimator. Three strategies are commonly used: instrumental variables (exploit variation in treatment assignment that is independent of the outcome, such as physician prescribing style); sensitivity analysis (bound the causal effect under violations of unconfoundedness using Rosenbaum bounds or E-values); and proximal causal learning (use proxy measurements of the hidden confounder to achieve identification). Each strategy trades off different assumptions about the structure of the confounding mechanism.
When treatment, outcome, and covariates all evolve over time — as in sepsis, cancer, or chronic disease management — standard adjustment for baseline covariates is insufficient. Intermediate variables can be both confounders (affecting later treatment decisions) and mediators (part of the causal pathway). Marginal structural models, G-estimation, and dynamic treatment regime estimation are designed specifically for this setting.
Applications in Medicine
Each item below illustrates a distinct failure mode of standard predictive modeling in medicine, and how an SCM resolves it. Click any card for the full case study and Bayes Server model.
The Practical Framework
The same six-step procedure governs every case in this series. Steps 1–3 are about identification — turning a clinical question into a well-posed estimand that is in principle answerable from data. Steps 4–6 are about estimation and validation — choosing the right method, stress-testing its assumptions, and establishing that the model output is trustworthy enough to inform a treatment decision.
Draw the DAG
Work with clinical domain experts to encode the causal structure as a directed acyclic graph. Every node is a variable; every edge is a direct causal mechanism. Hidden variables (genetic susceptibility, unmeasured severity) are represented as exogenous noise nodes U. The DAG is not inferred from data — it is a statement of scientific knowledge that data cannot contradict, only refine.
Identify the Estimand
Specify precisely what is being estimated: ATE (average across all patients), CATE (average within a covariate stratum), individual counterfactual outcome, or optimal treatment policy. The estimand determines which identification assumptions are needed and which data structure is required. A vague clinical question ("is this drug better?") must become a precise causal estimand before any analysis can begin.
Check Identifiability
Apply the backdoor criterion, frontdoor criterion, or do-calculus to determine whether the causal estimand is identifiable from the available data structure. If confounders block identification, consider instrumental variable strategies, proxy variables, or design-based solutions such as natural experiments. If the estimand is not identifiable, no amount of data or computation will produce a valid causal estimate — document this explicitly.
Choose an Estimator
Match the estimator to the data structure: T-learner or X-learner for imbalanced observational samples; DR-learner when a propensity model is available; Causal Forest for high-dimensional, non-linear heterogeneity; TARNet or CFRNet for large-scale deep learning settings. For time-varying treatments, use marginal structural models or G-estimation. For counterfactuals, the full SCM (abduction–action–prediction) is required.
Assess Sensitivity
All causal estimates rest on untestable assumptions. Quantify the robustness of the estimate to violations of those assumptions: Rosenbaum bounds for hidden confounders, E-values for unmeasured confounding strength, refutation tests (random common cause, placebo treatment, data subset). A causal estimate without a sensitivity analysis is not ready for clinical decision support.
Validate Causally
Predictive validation (held-out R²) is insufficient for causal models. Validate against external RCT data where available; use policy-level metrics (improvement in outcomes under the estimated optimal policy); and exploit natural experiments or quasi-experimental designs to benchmark the model's causal claims against variation that is as good as randomized. If no external validation is feasible, document the assumptions and their clinical implications explicitly.
Key Terms
Your predictive model is not a causal model — and the gap between them is exactly where patient harm lives.
info@rung3.ai
Pearl, J. & Mackenzie, D. (2018). The Book of Why. Basic Books. · Pearl, J. (2009). Causality: Models, Reasoning, and Inference. Cambridge University Press. · Künzel, S.R. et al. (2019). "Metalearners for estimating heterogeneous treatment effects." PNAS. · Wager, S. & Athey, S. (2018). "Estimation and inference of heterogeneous treatment effects using random forests." JASA. · Shalit, U. et al. (2017). "Estimating individual treatment effect: generalization bounds and algorithms." ICML.