Most analytical tools describe what happened. A causal model answers a different question: what would happen if you changed something. That distinction — between description and intervention — is the entire argument of this page.
What a Causal Model Is
What One Looks Like
A causal model is a diagram your team can debate on a whiteboard and hand to a regulator. The reasoning is not hidden in weights — it is explicit in the structure. Each node is a variable. Each arrow is a causal claim your team is willing to defend. When a regulator asks "why did the model recommend this control?", you point to the diagram.
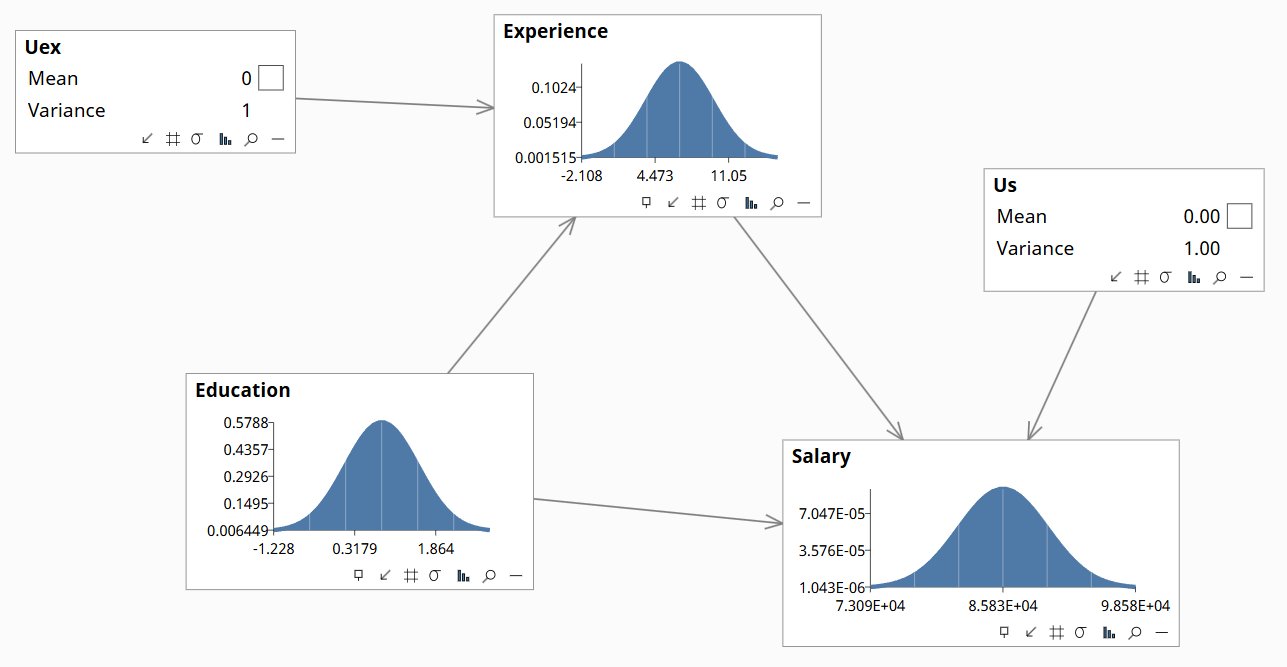
Just three components — the causal graph, the probability tables (not shown), and the unobserved factors — form a Structural Causal Model (SCM), the framework Judea Pearl formalized. It is the only mathematical structure proven sufficient to answer interventional and counterfactual questions from observational data.
| Component | Function |
|---|---|
| Causal graph | Encodes which variables cause which others. Nodes are variables; arrows are causal claims. Drawn by domain experts, not inferred from data. |
| Conditional probability tables | Quantify the strength of each causal relationship — estimated from data, elicited from experts, or both. |
| Unobserved factors (U variables) | Capture what makes each case unique — the things not in the data. Required for counterfactual reasoning. |
What It Does
A causal model encodes what your domain experts know — which variables drive which outcomes, through which mechanisms, with what magnitudes. That knowledge lives in the graph structure, not in opaque weights. It can be inspected, challenged, updated, and handed to a regulator. It is your domain IP made computable and permanently queryable.
The questions it answers are the ones no other tool can reach.
A causal model operates on all three rungs of Pearl’s Ladder — seeing (association), doing (intervention), and imagining (counterfactual). Most analytics tools stop at Rung 1. The Ladder page covers the formal distinction and the proof that the gap between rungs is structural, not one of degree.
Next in Methods: Pearl\'s Ladder →
How It Differs from the AI You Already Have
LLMs generate text about cause and effect fluently. That is not the same as computing causal quantities. The distinction is not one of capability level — it is structural.
| LLM | Causal Model | |
|---|---|---|
| Knowledge source | Text patterns in training data | Domain expert knowledge + data |
| Answers causal questions | Generates plausible text about them | Computes them mathematically |
| Auditable | No — weights are opaque | Yes — graph is explicit |
| Updates when world changes | Retrain on new data | Adjust the graph structure |
| Counterfactual reasoning | No — statistically impossible | Yes — by design |
The correct architecture is to use an LLM as the interface to a causal model — translating plain-language questions into formal queries and returning computed results in plain language. The causal model does the reasoning. The LLM handles the language. Causal Memory covers this architecture in detail.
If you are making consequential decisions under uncertainty, you already need a causal model.
info@rung3.ai